Author: Antonis

  • Iran Rejects US Ceasefire Overture, Contradicting Trump’s Negotiation Claims

    Iran Rejects US Ceasefire Overture, Contradicting Trump’s Negotiation Claims

    Iran’s state media reported on Monday that the Islamic Republic will not accept a US-proposed ceasefire, directly contradicting President Donald Trump’s assertion that the two nations are “in negotiations right now,” according to CNBC. The conflicting signals injected fresh uncertainty into geopolitical risk sentiment, with energy and safe-haven assets among the most closely watched markets in early trading.


    Context

    The messaging disconnect between Washington and Tehran represents a significant escalation in diplomatic ambiguity. According to CNBC, Iran’s state broadcaster flatly denied that any formal ceasefire talks are underway, while President Trump maintained publicly that negotiations are active. Analysts note that such contradictions may prolong uncertainty premiums embedded in crude oil and precious metals markets.

    Reuters has reported that Middle East tensions have remained elevated following recent military exchanges in the region, with oil supply routes through the Strait of Hormuz under continued scrutiny. The Strait of Hormuz handles an estimated 20% of global oil trade, according to the US Energy Information Administration, making any perceived supply disruption risk a persistent driver of crude price volatility.

    Markets are also weighing the broader implications for US foreign policy credibility. Analysts at Goldman Sachs Research have previously noted that unresolved Middle East conflicts tend to sustain a geopolitical risk premium in oil markets, though the magnitude may vary depending on the perceived proximity of direct supply disruption.


    Key Data

    • Crude Oil (CL=F): Front-month WTI crude has historically shown sensitivity to Strait of Hormuz risk narratives, with price levels and intraday moves tracked via CME Group.
    • Gold (GLD/XAU/USD): Spot gold has functioned as a traditional safe-haven asset during periods of elevated geopolitical uncertainty, per World Gold Council research. Current levels are observable via TradingView.
    • US Treasuries (TLT): Demand for long-duration US government bonds may rise in risk-off episodes; 10-year yield data is available via the US Treasury Department.
    • S&P 500 (SPY): Equity index futures could face modest pressure if risk-off sentiment persists, with real-time levels tracked via Bloomberg Markets.

    Market relationships are dynamic and may change over time. Past correlations do not guarantee future performance.


    Market Snapshot

    AssetLevelChangeSource
    WTI Crude (CL=F)See live dataElevated volatility flaggedCME Group
    Gold Spot (XAU/USD)See live dataSafe-haven demand notedTradingView
    S&P 500 Futures (ES)See live dataSentiment-drivenBloomberg
    10-Yr US Treasury YieldSee live dataRisk-off flows possibleUS Treasury
    USD/CADSee live dataOil-linked FX to watchReuters FX
    USO (Oil ETF)See live dataEnergy proxyMarketWatch

    Note: Live price levels shift continuously. Readers are encouraged to verify current data via the linked sources. Market relationships are dynamic and may change over time.


    Bull and Bear Perspectives

    Bull case for crude and gold: Traders may continue pricing in a geopolitical risk premium if the diplomatic impasse persists or escalates. Historically, prolonged uncertainty in the Middle East has tended to support energy prices and safe-haven assets, according to EIA analysis.

    Bear case: Should back-channel diplomacy resume or a de-escalation signal emerge from either side, the risk premium currently embedded in crude oil prices could unwind, potentially weighing on energy-linked assets. Reuters notes that diplomatic situations of this nature have historically seen rapid reversals.


    Events Ahead

    Markets may look to the following catalysts for further direction:

    • US–Iran diplomatic developments: Any official statement from the State Department or Iranian Foreign Ministry could shift sentiment rapidly. Monitor Reuters Middle East for updates.
    • EIA Weekly Crude Inventories: Scheduled release provides supply-side context for crude pricing. Calendar details via Investing.com Economic Calendar.
    • Federal Reserve speakers: Any commentary on geopolitical risks affecting the inflation or growth outlook may influence Treasury and equity markets. Fed schedule available at Federal Reserve.
    • OPEC+ monitoring: Any response from OPEC+ regarding production levels in light of Middle East tensions is worth watching, per OPEC Official Communications.

    Risk Disclaimer: Trading CFDs involves substantial risk and may result in the loss of your invested capital. CFDs are complex instruments and come with a high risk of losing money rapidly due to leverage. You should consider whether you understand how CFDs work and whether you can afford to take the high risk of losing your money. Past performance is not indicative of future results. This content is for informational and educational purposes only and does not constitute investment advice.

  • Earnings Reports: Analyzing Price Gaps in Tech Stocks

    Earnings Reports: Analyzing Price Gaps in Tech Stocks

    Four times a year, the financial markets participate in a ritual of high drama known as earnings season. For weeks, the atmosphere is thick with speculation, analyst revisions, and whispered rumors. Then, the numbers are released, usually after the closing bell rings, and the market delivers its verdict.

    When it comes to the technology sector, this verdict is rarely delivered with a gentle nudge. It is delivered with a sledgehammer. A tech company can close at $100 on Tuesday afternoon and open at $120 on Wednesday morning. Or, just as easily, it can open at $80. This empty space on the price chart, where no trading occurred, but the valuation changed dramatically, is known as a “gap.”

    For some market participants, these gaps may appear unpredictable. They can also reflect periods of significant supply and demand imbalance, which may be of interest when analysing market behaviour. The concept of “trading the gap” is about understanding the market dynamics behind these movements and how prices behave when trading resumes.

    Understanding the Mechanics of a Gap

    A price gap is simply a difference between the closing price of one day and the opening price of the next. In the context of earnings reports, these gaps may occur following the release of new information, which can lead market participants to re-evaluate the asset’s value.​

    In the tech sector, this repricing can be more pronounced because valuations are often influenced by expectations of future growth. When a company like Nvidia or Alphabet reports its quarterly results, investors are not just looking at the profit it made over the last ninety days. They are scrutinizing the “Forward Guidance,” the management’s projection of future revenues, capital expenditures, and AI monetization milestones.​​

    If the guidance is significantly better than expected, increased buying interest before the market opens may contribute to a ‘gap up.’ If guidance falls short of expectations, selling pressure may contribute to a ‘gap down.’”

    The Four Types of Earnings Gaps

    Not all gaps are created equal. The context of the chart before the earnings report is just as important as the numbers themselves.

    1. The Breakaway Gap (The Catalyst)
    This occurs when a stock has been moving sideways in a long consolidation phase, boring investors for months.  An earnings report that exceeds expectations can lead to a gap above this range. In some cases, this type of movement has been associated with the early stages of a developing trend, as market participants reassess the company’s outlook.”.​

    2. The Runaway Gap (The Accelerator)
    This is observed  when a stock is already in a strong uptrend, and the earnings report confirms the bullish thesis. The stock may gap up again, accelerating the trend. This type of movement can be associated with sustained buying interest, although it may also occur in later stages of a trend.

    3. The Exhaustion Gap (The Final Gasp)
    This pattern may occur after an extended upward movement. Following an earnings release, the stock may gap higher but subsequently decline during the same session, forming a long upper shadow on the chart. In some cases, this type of price action has been associated with shifts in market sentiment following the initial reaction.​

    4. The Gap Down (The Reality Check)
    When a technology company reports results below expectations, the stock may open lower, forming a gap down.  The severity of the continued selloff often depends on the broader market context and whether institutions view the miss as a temporary hiccup or a structural flaw in the business model.​

    Analytical Frameworks for the Modern Tech Market

    As we analyze tech earnings in 2026, the focus has shifted. It is no longer sufficient for a company to simply announce high revenue growth. The market has become discerning, demanding clarity on capital discipline and cash flow quality.​

    When a gap occurs, analysts typically dissect three key areas to determine if the new price level is sustainable:

    • The AI Monetization Question
      Tech companies are spending billions on infrastructure. The market wants to see how those investments are translating into actual revenue streams. A gap up driven purely by promises of future AI capabilities is often viewed with more skepticism than a gap up driven by measurable productivity gains and new software subscriptions.​
    • Margin Resilience
      If a company beats revenue estimates but reports shrinking profit margins due to  rising costs, the sustainability of a gap up may be affected. In some cases, companies that demonstrate cost management and pricing power may be viewed more favourably​
    • The “Beat and Raise” Dynamic
      The holy grail of an earnings report is the “beat and raise.” This means the company beat the current quarter’s expectations and raised its guidance for the next quarter. Gaps associated with a genuine beat and raise in some cases, showed different price behaviour compared to those driven primarily by past performance.

    Understanding the Gap: Observation over Anticipation

    A common pitfall for many participants is attempting to predict the direction of the gap before the earnings are released. This approach often resembles a coin toss. Even if an investor correctly guesses that a company will report strong numbers, the stock might still gap down if the market had already “priced in” an even stronger result. The market reaction is often counterintuitive to the headline numbers.

    One way to analyse these movements involves waiting for the gap to occur and observing the price action that follows.

    • The “Gap Fill” Concept
      There is a common trading adage that “all gaps must be filled.” This means that if a stock gaps up from $100 to $110, it will eventually trade back down to $100 to “fill” that empty space on the chart. While this is not a universal law, it happens frequently enough to warrant attention.

    Some market participants observe the first thirty minutes of trading (the opening range). If a stock gaps up but cannot maintain its momentum and begins to fall below its opening price, this may be interpreted as weaker follow-through in the initial move. Conversely, if a stock gaps down but immediately finds buyers and pushes higher, it may suggest the selloff was an overreaction.

    The Role of Context

    No gap exists in a vacuum. A positive earnings report from a single software company might fail to generate a sustained rally if the broader Nasdaq 100 index is experiencing a heavy selloff due to macroeconomic concerns like inflation data.

    Therefore, understanding the macro environment can be an important factor. The tech sector’s performance is often closely tied to interest rate expectations and global demand dynamics. Evaluating a gap requires synthesizing the company’s specific fundamental data with the broader market’s risk appetite at that specific moment.​

    Clearing the Noise

    Price gaps in tech stocks during earnings season often reflect underlying market psychology.  It requires looking past the sensational headlines and focusing on the underlying mechanics of supply, demand, and forward guidance.

    Market relationships are dynamic and may change over time. The patterns that defined earnings reactions in previous years may not hold as the technology sector evolves and the focus shifts from hardware buildouts to software monetization. Past performance and historical gap fills do not guarantee future results.

    In some cases, market participants focus on how price action develops following the initial reaction, including factors such as volume and overall market behaviour. Gaps can be viewed as a reflection of shifting market sentiment rather than a definitive signal.


    Final Reminder. Risk Never Sleeps: Trading involves risk and may not be suitable for all investors. This content is for educational and  informational purposes only and does not constitute investment advice or a recommendation.

  • Oil Slides Below $95 on Reports of US-Iran Ceasefire Proposal

    Oil Slides Below $95 on Reports of US-Iran Ceasefire Proposal

    Global crude oil prices fell below $95 per barrel during Monday’s session after MarketWatch reported that President Trump proposed a one-month ceasefire with Iran, prompting markets to reprice near-term geopolitical risk premium across energy markets.

    Context

    The reported ceasefire proposal, as covered by MarketWatch, has introduced the possibility of reduced supply disruption risk in the Strait of Hormuz — a critical chokepoint through which an estimated 20% of global oil trade passes, according to the U.S. Energy Information Administration (EIA). Traders appear to be unwinding a portion of the geopolitical risk premium that had been built into crude prices in preceding sessions.

    According to analysts cited by Reuters, markets have been sensitive to any signals that could reduce the probability of a direct confrontation affecting Iranian oil exports, which the EIA estimates at approximately 3.2 million barrels per day. A formal de-escalation, if confirmed, could alter the near-term supply outlook materially.

    However, analysts caution that ceasefire proposals in geopolitically complex situations may not translate into durable agreements. Uncertainty over diplomatic follow-through remains elevated, and any breakdown in talks could see risk premium re-enter prices. Market relationships between geopolitical developments and commodity prices are dynamic and may change over time.


    Key Data

    • WTI Crude (CL=F): Trading below $95.00/bbl, according to CME Group
    • Brent Crude (BZ=F): Tracking lower in parallel, per ICE Futures
    • The intraday move represents a notable pullback from recent session highs, as reported by MarketWatch
    • $95/bbl has historically acted as a psychologically significant level for WTI, per Bloomberg Markets
    • $90/bbl represents a further area that market participants have previously referenced as a key observational threshold, according to TradingView

    Market Snapshot

    AssetLevelChangeSource
    WTI Crude (CL=F)~$94.80/bbl▼ ~1.5–2.0% est.CME Group
    Brent Crude (BZ=F)~$98.20/bbl▼ ~1.3–1.8% est.ICE
    USO (Oil ETF)Tracking lower▼ IntradayYahoo Finance
    XLE (Energy Sector ETF)Declining▼ IntradayYahoo Finance
    USD Index (DXY)~104.20SteadyReuters
    S&P 500 FuturesModestly firmer▲ SlightBloomberg
    U.S. 10-Yr Yield~4.42%FlatU.S. Treasury

    Note: Price levels are indicative and subject to change. Percentage moves are estimates pending session close confirmation.


    Events Ahead

    Traders and analysts may be watching the following upcoming catalysts for further direction in energy markets:

    • EIA Weekly Crude Inventory Report — Weekly U.S. stockpile data could influence near-term supply sentiment; schedule available via EIA
    • OPEC+ Production Policy Updates — Any revision to output targets from the group could affect the supply-demand balance; monitor via OPEC Official Site
    • US-Iran Diplomatic Developments — Confirmation or denial of ceasefire terms may prompt further repricing of geopolitical risk premium; tracked via Reuters Geopolitics
    • US CPI Data — Inflation figures could influence Federal Reserve rate expectations, which may have secondary effects on USD-denominated commodity pricing; calendar via BLS
    • Fed Speaker Appearances — Any commentary on the economic outlook could affect broader risk sentiment; schedule via Federal Reserve

    Risk Disclaimer: Trading CFDs involves substantial risk and may result in the loss of your invested capital. CFDs are complex instruments and come with a high risk of losing money rapidly due to leverage. You should consider whether you understand how CFDs work and whether you can afford to take the high risk of losing your money. Past performance is not indicative of future results. This content is for informational and educational purposes only and does not constitute investment advice.

  • Nasdaq 100 vs. S&P 500: A Comparison for Tech-Focused Traders

    Nasdaq 100 vs. S&P 500: A Comparison for Tech-Focused Traders

    When it comes to trading the titans of the American economy, two heavyweight indices dominate the conversation. In one corner, you have the S&P 500, the venerable benchmark of corporate America, tracking the 500 largest companies across all sectors. In the other corner stands the Nasdaq 100, a leaner, more focused index tracking 100 of the largest non-financial companies, heavily skewed towards the technology sector.

    For the modern trader, choosing between these two instruments is not merely a matter of picking a ticker symbol. It is a decision about concentration, volatility, and exposure to the specific mechanics of the technology sector. It is often suggested that the S&P 500 provides broader diversification, while the Nasdaq 100 offers more concentrated exposure to the technology sector. However, recent market developments suggest, that traditional narrative requires a closer examination.

    This analysis will break down the structural differences, performance metrics, and behavioral characteristics of these two indices, exploring how they function in a market dominated by artificial intelligence and digital infrastructure.

    The Illusion of Diversification

    Historically, the primary argument for trading the S&P 500 was diversification. By holding 500 companies across sectors like financials, energy, industrials, and healthcare, exposure to a single industry may be reduced. If tech crashed, perhaps energy would rally, smoothing out the overall curve.

    The Nasdaq 100, by its very design, lacks this broad diversification. It explicitly excludes financial companies and is heavily weighted toward technology. The Nasdaq got its reputation as a tech-focused exchange early on, notably listing Microsoft in 1986, and it has maintained that DNA ever since. Today, the top holdings of the Nasdaq 100 are a familiar roster of tech giants, including Nvidia, Apple, Microsoft, Amazon, and Alphabet.

    However, the S&P 500 has undergone a quiet transformation. Because the S&P 500 is market capitalization weighted, the massive growth of the mega-cap tech companies has dramatically altered its composition. The same “Magnificent Seven” that dominate the Nasdaq 100 now also represent a significant portion  t of the S&P 500.

    This concentration suggests the performance of the S&P 500 is increasingly tethered to the performance of the technology sector. Some market observers have noted that as the tech giants grew, the correlation between the two indices increased significantly. By early 2026, analysis indicated that the rolling correlation between the two indices had reached extremely high levels, with one commentary suggesting they sometimes appeared to move in “perfect lockstep”.

    These developments suggest that the diversification characteristics of the S&P 500 may have evolved over time. While it remains a broad market index, its performance may be more influenced by large technology companies than in the past

    The Volatility Profile

    While the correlation between the two indices is high, their behavior during periods of market stress reveals key differences. The Nasdaq 100 has historically exhibited higher volatility compared to the S&P 500.

    Volatility is the trader’s raw material, and the Nasdaq 100 provides it in abundance. Over historical periods, the annualized volatility of the Nasdaq 100 is generally higher than that of the S&P 500. This means the price swings up and down are wider.

    This higher volatility can have varying effects. During certain market conditions, including periods associated with technological growth or accommodative monetary policy, the Nasdaq 100 has at times outperformed the S&P 500. The index acts like a magnifying glass for tech optimism. Furthermore, the companies within the Nasdaq 100 typically reinvest a larger portion of their revenue back into Research and Development compared to the broader S&P 500, which may support future growth initiatives.

    Conversely, during market corrections, the Nasdaq 100 often experiences deeper drawdowns. For example, during significant historical corrections, the percentage fall in the Nasdaq 100 was generally steeper than the corresponding fall in the S&P 500. Due to its more limited exposure to  defensive sectors like utilities or consumer staples, a tech selloff hits the Nasdaq 100 directly and forcefully.​

    The Mechanics of the Trade

    For a trader focusing specifically on the technology sector, the choice between the two indices comes down to the desired level of exposure.

    Trading the Nasdaq 100 may provide more concentrated exposure to themes such as technology, interest rates, and innovation. It has historically shown sensitivity to changes in monetary policy. Because many tech companies rely on future earnings to justify their valuations, higher interest rates discount the value of those future earnings, often causing the index to reprice sharply.In scenarios where market participants expect changes such as interest rate adjustments or increased investment in AI-related sectors, the Nasdaq 100 may reflect these themes more directly due to its composition.

    Trading the S&P 500, while still heavily influenced by tech, offers a slightly dampened experience. The presence of the “other 400” companies provides a buffer. If a regulatory crackdown specifically targets tech giants, the S&P 500 may weather the storm slightly better due to its exposure to financials and healthcare. It is a blunter instrument for tech trading, but one with a historically lower risk profile in terms of severe drawdowns.

    Furthermore, it is important to consider the macroeconomic forces that drive both indices simultaneously. During periods of broader economic crisis or recovery, factors such as inflation data and central bank policy may influence both indices, sometimes resulting in similar directional movements. A rising tide generally lifts both ships, and a draining pool lowers them both, even if the Nasdaq bobs up and down more violently in the process.​

    Conclusion: Comparing Index Characteristics

    The debate between the Nasdaq 100 and the S&P 500 is not about which index is inherently “better”  but about understanding the different characteristics of each instrument

    The Nasdaq 100 offers concentrated exposure to the companies building the digital infrastructure of the future. It has historically exhibited higher sensitivity to market movements, with periods of both strong performance and significant drawdowns.

    The S&P 500 offers a broader representation of the US economy, although it remains influenced by large technology companies. It has historically shown different volatility characteristics compared to the Nasdaq 100.

    Market relationships are dynamic and may change over time, and past correlations do not guarantee future performance. As the AI cycle matures and the global economic landscape shifts, the relative performance of these two indices will continue to evolve. Market participants may compare different indices based on their characteristics and prevailing market conditions when forming their own views.


    Final Reminder. Risk Never Sleeps: Trading involves risk and may not be suitable for all investors. This content is for informational purposes only and does not constitute investment advice or a recommendation.

  • Magnificent 7 Stocks: Are They Overbought in Q1 2026?

    Magnificent 7 Stocks: Are They Overbought in Q1 2026?

    For the past three years, the stock market has essentially been a one-act play. The stage was dominated by a small, elite group of technology titans known as the “Magnificent Seven.” These companies, which include Apple, Microsoft, Alphabet, Amazon, Nvidia, Meta, and Tesla, were previously seen as major players in the financial world.

    They carried the S&P 500 on their backs and drove indices to record highs while the rest of the market watched from the cheap seats.

    But as we navigate the first quarter of 2026, the mood music is changing. The once invincible cohort is showing signs of fatigue. Some of these titans have experienced early-year declines, with Microsoft, Tesla, and Amazon posting initial losses in early Q1 2026.

    The burning question on every investor’s mind is simple: Is the rally starting to lose momentum? Have the Magnificent Seven become so bloated with AI hype and capital expenditure that they are now officially overbought?

    This article explores the general market trends and concentration factors defining the Magnificent Seven in Q1 2026, looking at publicly available metrics.

    The Definition of Overbought

    Before diving into the metrics, it is helpful to explore how market observers discuss the concept of “overbought” in a general sense. It does not just mean a stock has gone up a lot. A stock can go up 100% and still be cheap if its earnings have gone up 500%.

    Market participants may view a stock as overbought when its price appears to disconnect from underlying business trends. This usually happens when investors stop paying for current profits and start paying significant premiums for future promises. In the case of the Magnificent Seven, the promise has a name: Artificial Intelligence.

    The CapEx Conundrum (The Cost of AI)

    A significant factor currently associated with the Magnificent Seven is not a lack of revenue, but a massive surge in spending. Building the infrastructure for the AI revolution is astronomically expensive. Major tech players, including Microsoft, Alphabet, Amazon, and Meta, are anticipated by industry analysts to incur substantial capital expenditures (CapEx) next year, with a significant portion allocated to AI data centers and chips.

    Consider the scale of this spending: Amazon and Microsoft have both reported or forecast substantial increases in their CapEx spending. This level of spending creates a classic Wall Street tension. The companies argue they are building the future. The analysts argue they are burning cash. Some market watchers note that the amount of revenue required to justify these capital expenditures is massive, leading to questions about whether these numbers are sustainable in the long run.

    Market observers note that if AI investments do not translate into profit growth, current market prices may face scrutiny. The market is beginning to ask for receipts, and the early 2026 selloffs suggest some impatience is setting in.

    Valuations vs Earnings Power

    Market participants often look at metrics like the Price to Earnings (P/E) ratio to gauge historical market trends. Historically, concerns about market concentration are not without merit. Today, the 10 largest companies in the S&P 500 account for approximately 39% of the index’s total market capitalization, which is well above the 27% peak reached during the technology bubble of 1999 [Source: Columbia Threadneedle Investments].

    This naturally invites comparisons to the Dot Com crash. However, the fundamental picture today is vastly different. During the tech bubble, many high-flying companies had no earnings. Today, the top 10 companies are generating significant profits. Earnings for the largest 10 companies were below 20% of the market at the peak of the tech bubble, but today that number is roughly 30%. The higher market capitalization reflects genuine earnings power.

    Currently, consensus estimates point to 18% earnings growth in 2026 for the Magnificent Seven [Source: Bank of America Global Research]. This is a robust figure, especially when compared to the broader market. Without the technology sector, the rest of the S&P 500 is only expected to see earnings rise by about 7.7% this year. Currently, the top 10 companies trade at a higher average P/E ratio (around 31) compared with approximately 21 for the rest of the market, this premium is largely supported by their superior growth rates and cash generation. These stocks generally trade at a premium compared to the broader market.

    The Divergence: The Group is Splitting

    Perhaps the biggest shift in Q1 2026 is that the Magnificent Seven is no longer trading as a monolith. The group is fracturing. Investors are no longer buying the entire basket blindly. They are becoming selective, rewarding the companies that are proving their AI models can generate cash, and punishing those that are perceived to be falling behind or overspending.

    For instance, Microsoft saw a significant one-day selloff on January 29, 2026 [Source: Microsoft Investor Relations / NASDAQ], after its earnings report, driven by specific concerns over its aggressive spending and the pace of its AI growth. This resulted in Microsoft briefly trading at lower relative multiples compared to its cohort based on certain metrics. Conversely, Meta is often highlighted as trading at a lower multiple within the group, trading at around 20 times its forward earnings estimates. Some analysts suggest that as Meta continues to report growth and integrate AI into its core advertising platform, its valuation gap relative to its peers may narrow.

    This divergence is healthy for the broader market. It suggests that investors are returning to fundamental analysis rather than purely chasing momentum.

    The “Other 493” Catching Up

    Another factor to consider is the “equal weight” S&P 500. While the headline S&P 500 index has been driven by the mega caps, looking at the equal weighted version where every stock has the same impact reveals a more modest, but still handsome, gain since the 2022 lows. There is an ongoing debate about whether the earnings momentum will broaden out to the other 493 companies in the index. However, recent data indicate that technology stocks have still experienced the most significant upward revisions in earnings estimates, suggesting that the momentum may remain biased towards tech for the time being [Source: Bank for International Settlements].

    Interestingly, some of the anticipated growth in sectors like utilities and industrials is actually being driven by investments from the large tech companies themselves, as they build out the energy-intensive infrastructure required for their data centers.

    Navigating the Tech Titans

    Are the Magnificent Seven overbought in Q1 2026? The answer is nuanced. They are certainly trading at historically elevated concentrations, and their massive capital expenditures introduce a new layer of execution risk. The days of easy, uniform gains across the entire cohort may be pausing as the market digests these massive investments.

    However, calling them a “bubble” may oversimplify the reality. Unlike the speculative manias of the past, these companies are generating unprecedented levels of free cash flow and dominating their respective industries. Their valuations are grounded in tangible earnings growth that continues to outpace the rest of the economy.

    For the market participant, the environment of 2026 requires a more discerning eye. The rising tide that lifted all seven boats has receded slightly, revealing which companies have built sustainable AI revenue models and which are simply swimming in expensive hardware.

    Market relationships are dynamic and may change over time, and past performance is never an indicator of future results. The era of the Magnificent Seven continues to evolve, prompting market participants to evaluate their broader market impact more closely.

    Final Reminder: Risk Never Sleeps

    Markets move fast, and risk is always part of the journey. This content is for educational purposes only and does not constitute investment advice or a recommendation to trade. Always do your own research before making financial decisions.

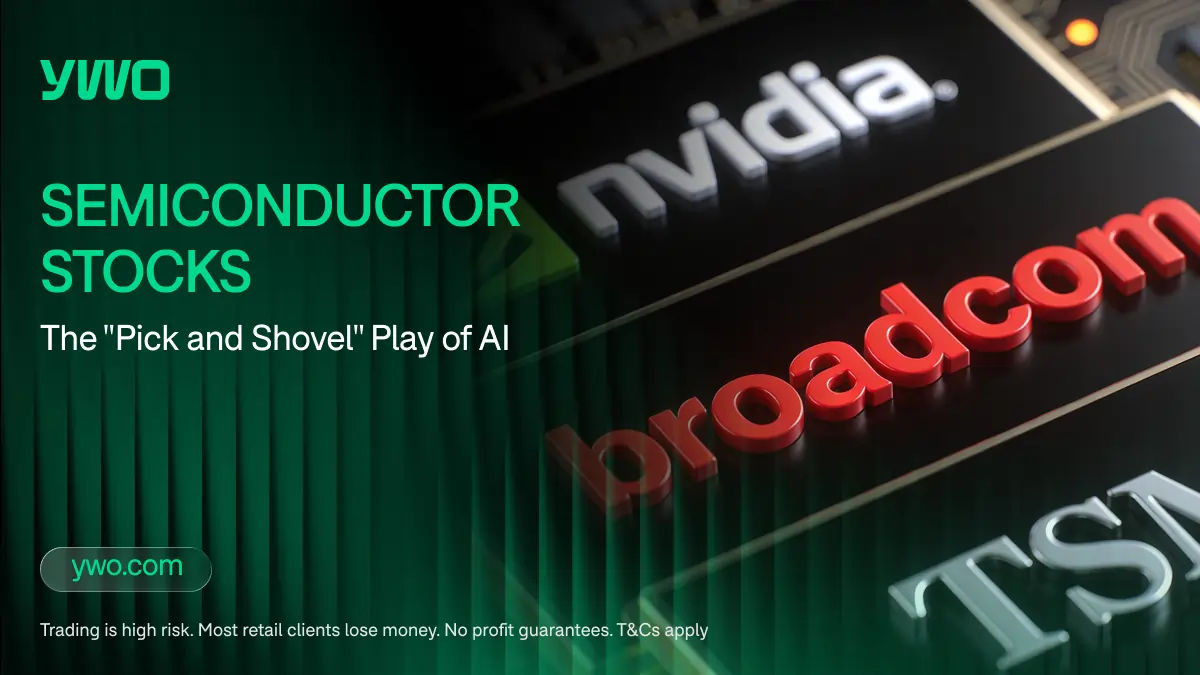
  • The Semiconductor Supply Chain Powering AI Infrastructure

    The Semiconductor Supply Chain Powering AI Infrastructure

    There is an old story from the California Gold Rush of 1849. When the news of gold broke, hundreds of thousands of prospectors rushed to the West Coast, dreaming of striking it rich. The vast majority of these miners found nothing but dirt and disappointment. But there was another group of people who made fortunes.

    They were the merchants who sold the picks, the shovels, and the denim jeans to the hopeful miners. They did not care if anyone actually found gold. They made money simply because the rush was happening.

    Today, we are witnessing a technological gold rush of unprecedented proportions, and the gold is Artificial Intelligence. The hyperscalers, companies like Amazon, Google, Microsoft, and Meta, are the prospectors.

    They are committing astronomical sums of money to build the infrastructure required to power the coming era of AI. Many industry analysts forecast capital expenditures in the hundreds of billions of dollars on AI infrastructure

    But as a trader evaluating the market, the sophisticated question to ask is not just who will build the best AI model. The question is: Which companies provide the underlying infrastructure?

    The answer lies deep within the semiconductor supply chain.

    The Anatomy of an AI Data Center

    To understand where the capital is flowing, one must understand what an AI data center actually requires. It is not just a room full of computers. It is an industrial-scale facility that requires staggering amounts of power, sophisticated cooling mechanisms, and an intricate web of specialized silicon.

    While the headline-grabbing Graphics Processing Units (GPUs) from companies like Nvidia get most of the attention, a GPU cannot function in isolation. It requires an entire ecosystem of supporting hardware. Industry estimates suggest chip solutions will account for roughly 50 to 60 percent of the massive AI data center spending planned for 2026.​

    This creates a broad surface area of opportunity across the semiconductor supply chain. The “pick and shovel” involves looking beyond the designers of the chips and focusing on the companies that manufacture them, connect them, and provide the essential materials for their operation.

    The Foundry Model: Where Silicon Meets the Factory

    The semiconductor industry has largely shifted to a “fabless” model over the last two decades. This means that companies like Nvidia, AMD, and Apple design their chips, but they do not actually manufacture them. They outsource the physical creation of the silicon to foundries.

    Taiwan Semiconductor Manufacturing Company (TSMC) is the Taiwan Semiconductor Manufacturing Company (TSMC) is a key leader in this domain. TSMC operates massive, highly complex fabrication plants (fabs) that turn silicon wafers into the microscopic brains of the modern economy.​

    As the hyperscalers pour billions into data center upgrades, the demand for cutting-edge manufacturing naturally flows to the foundries. Whether an AI company chooses to buy a standard GPU or designs its own custom AI accelerator chip (a growing trend among the tech giants), as the hyperscalers pour billions into data center upgrades, there is a strong expectation that TSMC will be the entity actually printing the silicon for many of these specialized chips.​

    This places the foundries at a critical point in the AI supply chain. The foundries benefit from the overall volume of the AI buildout, regardless of which specific chip designer ultimately wins the market share battle.

    The Connective Tissue: Networking and Memory

    An AI data center operates by breaking down massive computational tasks and distributing them across thousands of GPUs working in tandem. For this to work efficiently, the chips must be able to communicate with each other at lightning speed. If the network is slow, the expensive GPUs sit idle, waiting for data.

    This bottleneck has created intense demand for high-speed networking components. Companies that specialize in optical connectivity, active electrical cables, and high-bandwidth switches are important enablers of the AI infrastructure. These are the companies laying the neurological pathways of the data center.

    Similarly, AI models require massive amounts of data to function, which drives an insatiable appetite for advanced memory and storage solutions. High Bandwidth Memory (HBM) is particularly crucial, as it allows the processor to access data rapidly enough to keep pace with its computational speed. Companies positioned in the memory and storage sectors are seeing their products transition from cyclical commodities to essential infrastructure components.

    The Power and Thermal Equation

    Perhaps the most overlooked aspect of the AI boom is the physical reality of thermodynamics. The chips required for AI are incredibly powerful, and as a result, they generate an enormous amount of heat.

    The traditional method of blowing cold air over servers is no longer sufficient for the most advanced AI clusters. The industry is being forced to adopt advanced thermal management systems, including liquid cooling solutions. Companies that provide the physical infrastructure, from the cooling systems to the power distribution units—are capturing a portion of the capital expenditure.​

    In some ways, these infrastructure companies represent the ultimate “pick and shovel” concept. They do not carry the technological risk of designing the next generation of semiconductors, but their products are essential for the deployment of any high-density AI hardware.

    Supply Chain Realities and Geopolitical Factors

    While the demand outlook for the semiconductor sector appears robust, the path forward is not without potential obstacles. The global semiconductor supply chain is deeply interconnected, and its critical nature has attracted the attention of governments worldwide.

    Rising geopolitical tensions have led to increasing trade restrictions, particularly regarding next-generation AI chip technologies. Export controls can impact a broad footprint of the industry, from manufacturing equipment to advanced packaging tools.

    These factors can create bottlenecks and require companies to adapt quickly to ensure supply chain resilience. For the market participant, it is important to recognize that the semiconductor industry is heavily influenced by international trade policies. A company’s technological superiority is influenced by its exposure to potential regulatory friction.

    Evaluating the Infrastructure Cycle

    The buildout of AI infrastructure planned for 2026 represents a massive allocation of capital. The companies selling the essential components for this expansion, the foundries, the networking specialists, the memory producers, and the thermal management providers, are currently operating in an environment of high demand.​

    When evaluating these “pick and shovel” companies, market analysts often focus on metrics like contracted backlog and multi-year agreements. These indicators can provide insight into the visibility and potential stability of a company’s future earnings.​

    The transition to an AI driven economy is a complex, capital intensive process. By looking deeper into the supply chain, one can identify the critical components that make the entire system function. Market relationships are dynamic and may change over time, and past performance does not guarantee future results. However, as the digital gold rush continues, the merchants supplying the tools are positioned at the center of the activity.

    Final Reminder: Risk Never Sleeps

    Markets move fast, and risk is always part of the journey. This content is for educational purposes only and does not constitute investment advice or a recommendation to trade. Always do your own research before making financial decisions.

  • Petrocurrencies: How Oil Prices Affect CAD and NOK

    Petrocurrencies: How Oil Prices Affect CAD and NOK

    If you think the forex market is just about interest rates and central bank speeches, you are missing half the picture. Some currencies are closely linked to commodity exports — especially oil. s.

    Welcome to the world of Petrocurrencies.

    These are currencies belonging to nations whose economies are significantly influenced by  oil exports meaning  their exchange rates may at times show correlation  with the price of crude. When oil rise, these economies can benefit from improved trade balances and revenues. When oil prices decline, economic growth and fiscal conditions may face pressure.

    The two poster children for this phenomenon are the Canadian Dollar (CAD) and the Norwegian Krone (NOK).

    For the forex trader, understanding the potential relationship between oil prices and certain currencies can provide additional macroeconomic context. However, oil prices do not consistently determine currency direction, and exchange rates are also influenced by factors such as interest rates, monetary policy, and global risk sentiment.

    This guide will explore the mechanics of this relationship, why it breaks down, and how to trade it without getting slicked.

    The Logic: Why Oil Can Influence Currencies

    The mechanism is simple economics. Canada and Norway are significant oil exporters.

    • Canada sits on the third-largest oil reserves in the world (mostly in the oil sands of Alberta). It is a major supplier of energy to the United States.​
    • Norway is Western Europe’s largest oil and gas producer, with substantial output from the North Sea.

    When the price of oil rises:

    1. Revenue May  Increase: Canadian and Norwegian oil companies may receive higher USD revenues from oil exports.
    2. Currency Conversion Activity: A portion of those USD revenues may be converted into local currency (CAD or NOK) for domestic expenses such as taxes, salaries, and dividends.
    3. Potential Currency Impact: Increased demand for local currency, alongside improved trade balances and fiscal expectations, can contribute to upward pressure on CAD and NOK, depending on broader market conditions.

    Conversely, when oil crashes, export revenues may decrease.  Reduced inflows and weaker trade dynamics can contribute to downward pressure on these currencies, although the extent of any movement depends on additional factors such as monetary policy, global risk sentiment, and investor positioning.

    A weaker currency may partially offset lower oil revenues by making other exports more competitive internationally. However, this adjustment mechanism is not automatic and varies across market cycles.

    The Canadian Dollar (The Loonie)

    The CAD is often treated as a proxy for the US economy, but with an oil addiction.
    Because Canada exports 99% of its oil to the United States, the USD/CAD pair is the primary vehicle for trading this relationship.

    The Correlation: Historically, USD/CAD has an inverse relationship with Oil (WTI).

    • Oil UP has at times been associated withUSD/CAD DOWN (Stronger CAD)
    • Oil DOWN has at times been associated with USD/CAD UP (Weaker CAD)

    However, the relationship is getting complicated. In 2026, analysts have noted that the correlation is weakening. Why? Because the Canadian economy is diversifying, the Bank of Canada’s interest rate policy is sometimes out of sync with oil prices. If oil is falling but the Bank of Canada is raising rates to fight housing inflation, the CAD might rally despite the oil crash. This is called “decoupling,”.​

    The “Risk” Factor: CAD is also a “risk currency.” It tends to rise when the US stock market rises. Sometimes, high oil prices hurt the US consumer (who buys Canadian stuff), which is bad for Canada. So, CAD is caught in a tug-of-war between “High Oil is Good” (Exports) and “High Oil is Bad” (Global Recession).

    The Norwegian Krone (The Viking)

    Commodity-linked currencies such as CAD and NOK can be influenced by crude oil trends. Norway’s economy is smaller and less diversified than Canada’s. Therefore, the NOK is far more sensitive to Brent Crude prices than CAD is to WTI.​

    The Volatility: NOK is sometimes described as having higher sensitivity to commodity and risk sentiment shifts compared to more liquid major currencies.

    • In a global oil boom, NOK may experience stronger relative moves.
    • In a global oil crash, NOK may experience amplified volatility.

    However remember that these outcomes are not guaranteed and depend on broader macroeconomic conditions and market positioning.

    The “Liquidity” Problem: Unlike C major currencies, NOK is considered a  “minor.” Liquidity is lower. During periods of market stress, lower liquidity can contribute to sharper price movements.

    The Gas Factor: It is important to remember that Norway is also a major Natural Gas exporter to Europe. Following shifts in European energy markets in recent years, NOK has at times reflected developments in regional gas pricing alongside oil price dynamics. Seasonal demand fluctuations, particularly in winter months, may influence energy prices and, in turn, market expectations for NOK.

    When the Relationship Weakens

    Periods of heightened risk can emerge when correlations between oil prices and petrocurrencies weaken or temporarily break down.  This usually happens due to Monetary Policy Divergence.

    Scenario (Illustrative Example)

    Oil prices are rising (Bullish for CAD), but the Canadian housing market is crashing, forcing the Bank of Canada to cut interest rates (Bearish for CAD).

    Potential Outcome: The interest rate factor overpowers the oil factor. CAD falls despite rising oil.

    Market participants who rely solely on a single variable, such as oil prices, may face increased risk if broader macroeconomic forces dominate. In 2026, analysts have also noted that USD/CAD dynamics may at times be influenced more by trade developments, geopolitical considerations, or US economic performance than by short-term fluctuations in crude prices. Correlations can evolve over time.​

    Analytical Approaches Market Participants Sometimes Use

    The following are general analytical frameworks used by some traders. They are provided for educational discussion only and do not constitute trading recommendations.

    1. The “Confirmation” Trade

    Some participants monitor oil price movements alongside USD/CAD to assess whether macro signals are aligned.

    Rather than assuming oil price direction will determine currency movement, oil trends may be viewed as one of several confirming or conflicting factors within a broader analysis that includes technical levels, interest rate expectations, and risk sentiment.

    Conflicting signals may indicate increased uncertainty.

    2. The NOK/SEK Spread

    Some market participants analyse NOK relative to SEK, as Sweden is less directly exposed to oil exports than Norway.

    Because NOK may at times show sensitivity to energy prices, the NOK/SEK pair is sometimes studied in the context of commodity-driven divergence. However, both currencies remain influenced by regional growth, central bank policy, and global risk conditions.

    Correlation between energy prices and NOK/SEK is not stable and may shift over time.

    3. The Hedge

    Energy price exposure can affect various sectors, including transportation and airlines. Some investors explore currency exposure as part of broader portfolio risk management strategies.

    However, hedging strategies involve their own risks and may not perform as expected. Currency movements do not always offset commodity-related equity exposure, and imperfect correlation can result in residual risk.

    Conclusion: It’s Not Just About the Barrel

    Petrocurrencies offer a fascinating way to trade the energy market without touching a futures contract. They allow you to express a view on oil with the liquidity of the forex market.

    But remember, currencies are complex beasts. Canada is not just an oil well with a flag, and Norway is not just a gas station with fjords. They have central banks, housing bubbles, and political risks. Oil is a strong wind that pushes these currencies, but it is not the only wind. If you ignore the other storms brewing on the horizon, you might find your ship capsized, regardless of the price of crude.

    Final Reminder: Risk Never Sleeps

    Heads up: Trading is risky. This is only educational information, not investment advice. Trading leveraged products involves significant risk and may result in losses exceeding deposits. Past performance does not guarantee future results.

  • OPEC+ Meetings: How Production Cuts Impact Your Charts

    OPEC+ Meetings: How Production Cuts Impact Your Charts

    In the intricate ballet of global economics, few events command as much attention as the meetings of the Organization of the Petroleum Exporting Countries and its allies, collectively known as OPEC+.

    These gatherings are part diplomatic summit, part business negotiation, and part high-stakes poker game. For the oil trader, they are closely watched events that can influence price expectations and volatility.

    OPEC+ controls roughly 40 percent of the world’s oil production. This gives the group significant influence over global supply expectations. When they decide to turn the taps on, prices plummet. When they decide to turn them off, prices soar. Understanding the mechanics of these decisions is not just academic. It is the difference between catching a trend and being crushed by it.

    This guide will examine how production adjustments are structured, why market reactions do not always follow headlines, and how these developments may be reflected in price behaviour across energy markets.

    The Mechanics of the Cut

    When OPEC+ announces a production cut, they are effectively trying to manipulate the laws of supply and demand. By artificially reducing the supply of oil available to the global market, they aim to support or increase prices.

    The theory is relatively straightforward. If global demand is 100 million barrels per day and OPEC+ cuts supply by 2 million barrels per day, a deficit may be created, depending on other producers’ output and demand conditions. Buyers competing for fewer barrels can contribute to upward price pressure. It is the same logic that makes diamonds expensive or concert tickets for a sold-out show valuable. Scarcity creates value.

    However, the reality is rarely that simple. The market does not just look at the headline number. It looks at the credibility of the number.

    There is a concept known as “Paper Barrels” versus “Real Barrels.” Often, OPEC+ countries are already producing below their quota due to underinvestment or sanctions, or internal strife. Countries like Nigeria and Angola have struggled for years to meet their targets. If they announce a “cut,” it might just be a cut to their theoretical limit and not their actual production. The market is smart enough to ignore these “paper cuts.” If you promise not to produce oil you were not going to produce anyway, the supply balance does not change.

    Then there is the issue of compliance. Historically, OPEC members are notorious for agreeing to cuts in Vienna and then quietly pumping more oil when they get home. They need the revenue. If compliance is low, the price rally will fizzle out quickly. The market watches tanker tracking data like a hawk. If the exports do not drop, the price rally collapses.

    Reading the Chart: The Three Stages of an OPEC+ Meeting

    An OPEC+ meeting is not a single point in time. It is a process that unfolds over weeks.

    Stage 1: The Rumor Mill

    Weeks before the ministers meet, “sources” start leaking information to the press. You will see headlines like “Saudi Arabia considering unilateral cut” or “Russia opposes further tightening.”
    This is often a period of elevated  volatility. You will see “whipsaw” s algorithms and discretionary traders react to evolving headlines. Some market participants may begin positioning ahead of a potential decision.On the chart, this often looks like a series of higher lows. The price refuses to break down because traders are afraid to be short going into the meeting. The “fear premium” may begin to be reflected in price levels.

    Stage 2: The Decision

    The announcement usually comes on a Sunday or during European trading hours.

    If it is a Bullish Surprise where they cut more than expected, the price will possibly gaps up immediately. If you are not already in the trade, it is often too late to chase it.

    If it is a Bearish Surprise where they cut less than expected or just “roll over” existing cuts when the market wants more, the price will likely crash.

    Then there is the classic “Sell the Fact.” In such cases, prices may initially spike and then retrace as traders adjust positions. Short-term volatility following headlines can be significant and unpredictable. S

    Stage 3: The Aftermath

    In the days following the meeting, the market digests the details. This is where the trend is established. Traders watch the “compliance” question. They watch the physical market. A successful cut usually tightens the Brent versus WTI spread. Because OPEC production is mostly heavy and sour oil, which is similar to Brent, cutting it supports Brent prices more than WTI prices initially. A widening Brent premium can be interpreted by some participants as an indication that supply conditions are tightening, although multiple factors influence spread dynamics.

    The Cheater’s Discount

    One of the most reliable chart patterns associated with OPEC+ is the failure of a rally due to non-compliance.

    If the chart spikes on a cut announcement but fails to hold the new high within 48 hours, some market participants interpret this as a sign that confidence in implementation may be limited.

    As of recent years, countries like Iraq and Kazakhstan have been persistent over producers, which undermines the group’s efforts. When the market sees this data, usually leaked a few weeks later, the “OPEC Premium” evaporates and the downtrend resumes.

    This can create a specific technical setup known as the “Gap Fill.” When the price gaps up on Monday morning after a Sunday meeting, leave a mark on the chart at the closing price of Friday. If the price trades back down to that level, the gap is filled. In OPEC+ trades, a gap fill is often a very bearish signal. In some technical frameworks, a gap fill may be viewed as a sign that initial bullish momentum has faded, although interpretations vary.

    The Voluntary Cut vs The Official Cut

    In recent years, OPEC+ has introduced a confusing new tactic called the “Voluntary Cut.” where certain member countries announce additional reductions beyond formal group agreements.” Some analysts interpret voluntary cuts as a sign of uneven burden-sharing within the group, while others view them as targeted supply management tools. Market reactions can vary depending on credibility, duration, and broader demand conditions.

    Charts often react poorly to voluntary cuts. They are seen as temporary and fragile. If additional supply later returns to the market, price support may weaken depending on prevailing demand and inventory levels.

    Conclusion: Trust the Flow, Not the Press Release

    OPEC+ meetings are theater. The ministers hold hands and smile for the cameras and project unity. But the charts tell the real story of supply and demand. Do not focus on the headline. Focus on the reaction to the headline.

    If a “large  cut” cannot push prices through key resistance, some participants may interpret this as a sign that demand conditions are limiting upside momentum or that the market questions implementation. In the oil market,  price and trading volume provide insight into how expectations are being absorbed.

    The savvy trader learns to ignore the rhetoric and focus on the structure. For example, if prices are forming higher highs leading into a meeting, it may indicate stronger buying interest. If prices decline despite announced cuts, it may suggest that broader supply or demand factors are dominating.

    OPEC+ can announce whatever it wants. But they cannot force refiners to buy oil they do not need. Over time, price action reflects the balance between supply, demand, and positioning. The chart is one tool market participants use to assess that balance.

    Final Reminder: Risk Never Sleeps

    Heads up: Trading is risky. This is only educational information, not investment advice. Trading leveraged products involves significant risk and may result in losses exceeding deposits. Past performance does not guarantee future results.

  • Brent vs. WTI: What’s the Difference and Which Should You Trade?

    Brent vs. WTI: What’s the Difference and Which Should You Trade?

    In the chaotic theater of global finance, crude oil is the prima donna. It is volatile, dramatic, and essential for the functioning of modern civilization. It is the blood of the economy, although much stickier and harder to get out of carpets.

    However, when a new trader decides to enter the energy market, they are immediately confronted with a confusing reality. There isn’t just one “oil” price. There are two primary benchmarks, and they rarely agree on what a barrel is worth. You have Brent Crude, the sophisticated European aristocrat, and West Texas Intermediate (WTI), the rugged American cowboy.

    To the uninitiated, oil is oil. It is black, it burns, and it makes cars go. But to the professional trader, the difference between Brent and WTI is the difference between champagne and bourbon. They may both get the job done, but the provenance, the flavor profile, and the price tag are distinct.

    This guide will dissect the geology, geography, and geopolitics that separate these two titans, and help you decide which one deserves your capital.

    The Chemistry: Sweet, Sour, and Light

    Before we discuss money, we must discuss chemistry. Not all dinosaur juice is created equal.

    Oil is graded by two main metrics: Density (API Gravity) and Sulfur Content.
    If oil has low sulfur, it is called “Sweet.” If it has high sulfur, it is “Sour.”
    If oil is thin and flows easily, it is “Light.” If it is thick and sludge-like, it is “Heavy.”

    Refineries love Light Sweet oil. It is the “wagyu beef” of the energy world because it is easy and cheap to refine into high-value products like gasoline and diesel. Heavy Sour oil is the cheap ground chuck; it requires expensive, complex refineries to process.

    WTI (West Texas Intermediate): This is the gold standard of chemistry. It is extremely light and extremely sweet (0.24% sulfur). It is practically ready to put in your gas tank straight out of the ground. This makes it highly desirable for US refineries.

    Brent Crude: This is a blend of oils from the North Sea. It is also light and sweet, but slightly “heavier” and “sourer” than WTI (0.37% sulfur).

    The Verdict: In a vacuum, WTI is often considered a higher-quality crude. Chemically, it should be more expensive. But markets do not exist in a vacuum. They exist in the real world, where logistics matter more than chemistry.

    The Geography: Landlocked vs. Seaborne

    Here lies the true heart of the conflict. The primary difference between Brent and WTI is not what they are, but where they are.

    Brent is seaborne

    Brent comes from offshore oil fields in the North Sea, between the UK and Norway. Because it is extracted at sea, it can be loaded directly onto supertankers and shipped anywhere on the planet. It is the ultimate global traveler. If Europe doesn’t want it, it goes to China. If China doesn’t want it, it goes to Brazil.

    This flexibility makes Brent the global benchmark. A significant portion  of the world’s internationally traded oil contracts are priced off Brent.

    WTI is landlocked

    WTI comes from the Permian Basin in Texas and other US shale fields. To get to market, it must travel through a maze of pipelines to a small town called Cushing, Oklahoma. Cushing is the “pipeline crossroads of the world,” a dusty town filled with massive storage tanks. From Cushing, WTI must be piped down to the Gulf Coast to be refined or exported.This infrastructure creates logistical constraints.. If pipeline capacity is limited or storage at Cushing approaches capacity, pricing pressure can develop due to localized supply bottlenecks..

    The “Negative Oil” Moment

    This geographical flaw became highly visible  in April 2020. During the pandemic, demand collapsed. The storage tanks in Cushing filled up. Traders who held WTI futures contracts suddenly realized they had no place to put the physical oil. Panic ensued. The price of WTI fell to minus $37 per barrel. Traders were effectively paying people to take the oil away.
    Brent, being seaborne, simply floated on ships until buyers were found. It dropped, but it never went negative. That is the premium of flexibility.​

    The Spread: The Arbitrage of the Atlantic

    The price difference between the two is called The Spread. 

    Historically, WTI traded at a premium because of its superior chemistry. But since the shale boom flooded the US with oil, and because of the logistical constraints of Cushing, WTI now typically trades at a discount to Brent.

    This spread (Brent minus WTI) usually hovers between $3 and $6 per barrel.

    • When the Spread Widens: It usually means US production is booming, and there is a glut of oil stuck in Oklahoma. Or, it means there is a geopolitical crisis in the Middle East driving up Brent (the global price) while the US remains insulated.
    • When the Spread Narrows: It usually means US exports are flowing freely, draining Cushing, and connecting WTI to the global market.

    Geopolitics vs. Economics

    Because of their locations, the two benchmarks react to different stimuli.

    Brent is often more sensitive to:

    • OPEC: The cartel’s decisions impact global supply, which hits Brent first.
    • Middle East Conflict: Any tension in the Strait of Hormuz or the Suez Canal spikes Brent because it threatens seaborne trade.
    • Russia/Ukraine: Sanctions and supply disruptions in Europe are a Brent story.

    WTI is often more sensitive to::

    • US Inventory Reports (EIA): Every Wednesday, the US government releases data on how much oil is sitting in Cushing. This is the holy grail for WTI traders.
    • Hurricane Season: Storms in the Gulf of Mexico shut down US refineries and rigs, causing WTI volatility.
    • US Shale Production: The rig count in Texas determines the future supply of WTI.

    Trading Strategies: How to Play the Game

    Oil trading can involve significant volatility. Prices can trend strongly and reverse quickly, particularly around major geopolitical or macroeconomic events..

    1. The “News Fade”

    Oil reacts violently to headlines. A rumor of a war can send prices up several dollars in minutes. Often, these moves are exaggerated. One approach involves waiting for the initial volatility to stabilize before considering a counter-move, based on broader supply and demand fundamentals. Such strategies carry substantial risk, especially during fast-moving markets..

    2. The Spread Trade

    This is a more advanced  strategy. Instead of taking a directional view on crude oil prices, a trader focuses on the price difference between Brent and WTI. If the spread appears historically wide (for example, $10), a trader might buy WTI and sell Brent, anticipating a narrowing of the gap.

    In theory, this structure reduces exposure to overall oil price direction and focuses on relative pricing. However, spread trades are not risk-free. Divergences can persist longer than expected, and liquidity or logistical disruptions can widen spreads further.

    n.​

    3. The Inventory Pop

    On Wednesdays at 10:30 AM EST, the EIA report is released. If inventories are lower than expected, WTI often spikes. Traders look to catch the momentum of this breakout. However, beware the “whipsaw”: algorithms often jerk the price both ways to clear out stop losses before the real trend begins.

    The Verdict: Which One is For You?

    So, do you choose the Aristocrat or the Cowboy?

    WTI may appeal to traders who::

    • Focus on short-term strategies and actively trade U.S. session volatility.
    • Monitor U.S. inventory data, refinery utilization, and shale production trends.
    • Prefer instruments closely tied to the NYMEX futures market..

    : Brent may appeal to traders who: 

    • Focus on broader macroeconomic and geopolitical developments.
    • Trade primarily during European market hours.
    • Monitor global supply flows and OPEC-related developments.

    Both benchmarks carry significant volatility risk, and neither is inherently safer than the other.

    Conclusion: Respect the Risk

    Whether trading Brent or WTI, it is important to recognize that crude oil is influenced by geopolitics, supply decisions by major producing nations, economic cycles, and logistical constraints.

    Oil does not move in cents. It moves in dollars. It can make a year’s worth of profit in a month, or wipe out a year’s worth of savings in an afternoon.

    Choose your benchmark, understand its personality, and never, ever forget to check the storage levels in Cushing. Because, as the traders of April 2020 learned, when the Cowboy runs out of room to park his horse, things get ugly very fast.

    Final Reminder: Risk Never Sleeps

    Heads up: Trading is risky. This is only educational information, not investment advice.

  • Major Pairs vs. Cross Pairs: Where Should New Traders Start?

    Major Pairs vs. Cross Pairs: Where Should New Traders Start?

    The moment a new entrant opens a Forex trading terminal is often defined by a peculiar mixture of awe and paralysis. The screen blinks with an array of red and green numbers. Tickers scroll by continuously. It resembles a control room for the global economy — and in many ways, it reflects global capital flows in motion. In this digital candy store of financial instruments, the newcomer is immediately presented with a choice that feels trivial but is actually foundational. It is the choice of battlefield.

    Do you align yourself with the Major Pairs, the colossal titans of the currency world that move with the weight of empires? Or do you venture into the Cross Pairs, the more specialized combinations where liquidity and volatility characteristics can differ significantly?

    It is a question of “major vs cross pairs” that has divided trading floors for decades. One offers the safety of the crowd and the comfort of liquidity. The other offers the thrill of volatility and the allure of pure, unadulterated trends. Understanding the distinction is not merely about memorizing ticker symbols. It is about understanding structural behavior of different currency markets.

    The Aristocracy: Understanding the Major Pairs

    In the hierarchy of forex trading, the US Dollar is widely regarded as the dominant global reserve currency. It plays a central role in trade invoicing, global debt markets, and risk sentiment. During periods of global uncertainty, capital often flows into the Dollar. During periods of higher risk appetite, capital may rotate away from it. This central role means that any currency pair involving the USD is referred to as a “Major.”

    The Major Pairs are the blue bloods of the market. They include the Euro (EUR/USD), the Japanese Yen (USD/JPY), the British Pound (GBP/USD), and the Swiss Franc (USD/CHF). These four form the inner circle. We also grant a seat at the table to the commodity backed currencies like the Australian Dollar (AUD/USD), the New Zealand Dollar (NZD/USD), and the Canadian Dollar (USD/CAD).

    Trading the Majors is akin to attending a massive stadium concert. You are never alone. The liquidity is so deep that it is practically bottomless. Hedge funds, central banks, multinational corporations, and tourists are all throwing billions of dollars into these pairs every single second. This creates a specific kind of environment.

    The primary characteristic of the Majors is efficiency. Because so many eyes are watching EUR/USD, it is very difficult for the price to become “wrong” for very long. If the price drifts too far from what the economic data suggests, an army of algorithms will snap it back into line. This can make the Majors comparatively stable in terms of liquidity, though not immune to volatility.

    For the novice, this stability is a double edged sword. On one hand, the “spread” (the cost to enter the trade) is typically lower than in less liquid pairs. Brokers effectively let you into the EUR/USD party for free because the volume is so high. You can enter and exit trades with minimal friction. If you make a mistake, the market is unlikely to gap against you by fifty pips in a single blink of an eye. It is a forgiving environment.

    On the other hand, the Majors are often heavily influenced by macroeconomic narratives, particularly U.S. monetary policy. When you trade EUR/USD,  exposure to Federal Reserve policy expectations is significant. If the US data is ambiguous, the Majors tend to go nowhere. They drift. They chop. They create false signals that trap eager traders who mistake random noise for a genuine trend. Trading the Majors often feels like trying to have a conversation in a crowded room. There is a lot of noise, but it can be hard to hear the signal.

    The Avant Garde: The Allure of Cross Pairs

    If the Majors are the stadium concert, the Cross Pairs are the underground jazz club where the air is thick with smoke and the rhythm is unpredictable. A Cross Pair is defined simply by what it lacks. It lacks the US Dollar.

    These pairs are mathematically derived relationships. The price of the Euro against the Yen (EUR/JPY) is calculated by triangulating the Euro against the Dollar and the Dollar against the Yen. The Dollar is still there, lurking in the background like a silent partner, but it is not the headline act.

    Traders are drawn to cross pairs for their purity. There are times when the US economy is stuck in neutral. The data is mixed. The Fed is silent. The Dollar is doing absolutely nothing. In the world of Majors, this means paralysis. But in the world of Crosses, there is always a story happening somewhere.

    Perhaps the United Kingdom is struggling with high inflation while Switzerland is enjoying deflationary stability. If you trade GBP/USD, you are tethered to the boring Dollar. But if you trade GBP/CHF, you get a front row seat to the specific economic divergence between Britain and Switzerland. You are trading the “pure” story of those two economies.

    This relative independence can sometimes lead to trends that appear more directional than those in certain Major pairs. s. Cross pairs are less buffeted by the daily noise of US economic reports. They chart their own course. This is particularly true for the “Yen Crosses” like GBP/JPY and AUD/JPY.

    These pairs are beloved by adrenaline seeking traders because they act as barometers for global risk sentiment. When the world is happy, these pairs soar. When the world is anxious, they collapse. They do not drift. They sprint.

    However, this volatility comes with trade-offs.  The cost of admission to the Cross Pair club can be higher. Because fewer people trade AUD/NZD than EUR/USD, the liquidity tends to be  thinner. To compensate for this risk, brokers charge a wider spread. If entering a trade on the Euro costs you 1 pip, entering a trade on the Pound against the New Zealand Dollar may cost several pips more. This increases the break even threshold for the trade.

    Furthermore, the thinner liquidity means that Cross Pairs are prone to “whipsaws.” A single large order from a Tokyo bank can send a cross pair spiking twenty pips in a vacuum, triggering stop losses before immediately reversing. It is a rougher neighborhood.Movements can be faster and more pronounced, requiring disciplined risk management.

    The Personality Test: Matching the Pair to the Trader

    The debate of major vs cross pairs is often less about market mechanics and more about psychological compatibility. Different pairs attract different personalities.

    The Majors appeal to the “Accountant” personality. These traders value precision, low costs, and logical correlations. They like the fact that EUR/USD moves in an inverse relationship to the Dollar Index. They appreciate that news events are scheduled in advance. Some are comfortable with quieter market phases in exchange for generally deeper liquidity. They may prefer trading currencies backed by large, established economies.

    The Cross Pairs appeal to the “Artist” or perhaps the “Gambler” personality. These traders find the Majors suffocatingly slow. They look at a chart of EUR/GBP and see a beautiful, ranging waltz between two neighbors. They look at GBP/JPY, affectionately known as “The Beast,” as a highly volatile pair capable of large price swings. They may accept wider spreads and sharper intraday movements in exchange for increased volatility. However, higher volatility also increases risk exposure and potential losses.

    There is also the “Yield Hunter,” a specific species of trader who lives almost exclusively in the Cross Pairs. These individuals engage in the Carry Trade, seeking out pairs where the interest rate differential is greatest. For example, a trader might consider MXN/JPY due to its rate differential. However, interest income is not guaranteed and can be offset by currency depreciation, volatility, or changes in monetary policy. Such strategies carry significant risk, particularly when leverage is used. Cross pairs can offer larger rate differentials than some Major pairs, but they also introduce higher volatility and liquidity considerations.

    The Volatility Paradox

    New traders often make the mistake of assuming that “Major” means “Safe” and “Cross” means “Dangerous.” This is a dangerous oversimplification.  While liquidity can provide relative stability under normal conditions, volatility can emerge in any segment of the market. t.

    There are times when the Majors become the most volatile assets on the screen. During a major geopolitical crisis or a surprise change in Federal Reserve policy, the US Dollar becomes the epicenter of the earthquake. In those moments, the “safe” EUR/USD can experience sharp swings that may lead to significant losses, particularly in leveraged accounts.

    Conversely, there are Cross Pairs that trade within narrow ranges for extended periods. EUR/CHF (Euro against Swiss Franc) spent years moving less than a fraction of a percent a day because the two economies are so tightly integrated. A trader looking for excitement in that pair may find limited opportunity.

    Therefore, the decision of where to start in forex trading should not be based on labels, but on current market conditions. A sophisticated trader does not pledge loyalty to a ticker symbol. They scan the horizon. If the US Dollar is the story of the day, they trade the Majors. If the US Dollar is asleep, they look to the Crosses to see who is awake.

    The Educational Curve

    For the absolute neophyte, there is a compelling argument to begin the journey in the Majors. This is not because they are easier to trade, but because they are cheaper to learn on.

    Learning to trade is effectively a tuition process where the losses are the fees. Since the spreads on Majors are so low, the “tuition” is cheaper. You can execute hundreds of trades on AUD/USD to practice your strategy without the transaction costs eating a significant percentage of your capital. Doing the same volume of practice on a wide spread pair like GBP/NZD is mathematically punitive. The transaction costs alone creates a headwind that is difficult for a beginner strategy to overcome.

    Furthermore, the Majors teach you the fundamental interconnectedness of the global economy. By watching how gold impacts AUD/USD, or how oil impacts USD/CAD, you learn the macro relationships that drive the financial world. The Majors are the textbook. The Crosses are the advanced seminar. It is usually wise to read the textbook before signing up for the seminar.

    Conclusion

    The distinction between Major Pairs and Cross Pairs is one of the first structural concepts a trader encounters, and it remains relevant even after decades of experience. The Majors offer the efficiency of the highway: fast, direct, and crowded. The Crosses offer the scenic route: winding, potentially hazardous, but capable of taking you to destinations the highway never reaches.

    There is no moral superiority in trading one over the other. The market does not care if you made your money shorting the impeccable USD/CHF or longing the chaotic AUD/JPY. It only cares that you understood the vehicle you were driving.

    For the new arrival to the screen, the advice is often to start where the lights are brightest and the liquidity is deepest. Master the Majors. Learn to survive the noise of the Dollar. Learn to navigate the choppy waters of the Euro. Once you have proven you can keep your head above water in the main pool, then, and only then, is it time to venture into the deep end where the Crosses live. The Beast will still be there waiting for you. There is no need to rush the introduction.

    Final Reminder: Risk Never Sleeps

    Heads up: Trading is risky. This is only educational information, not investment advice.