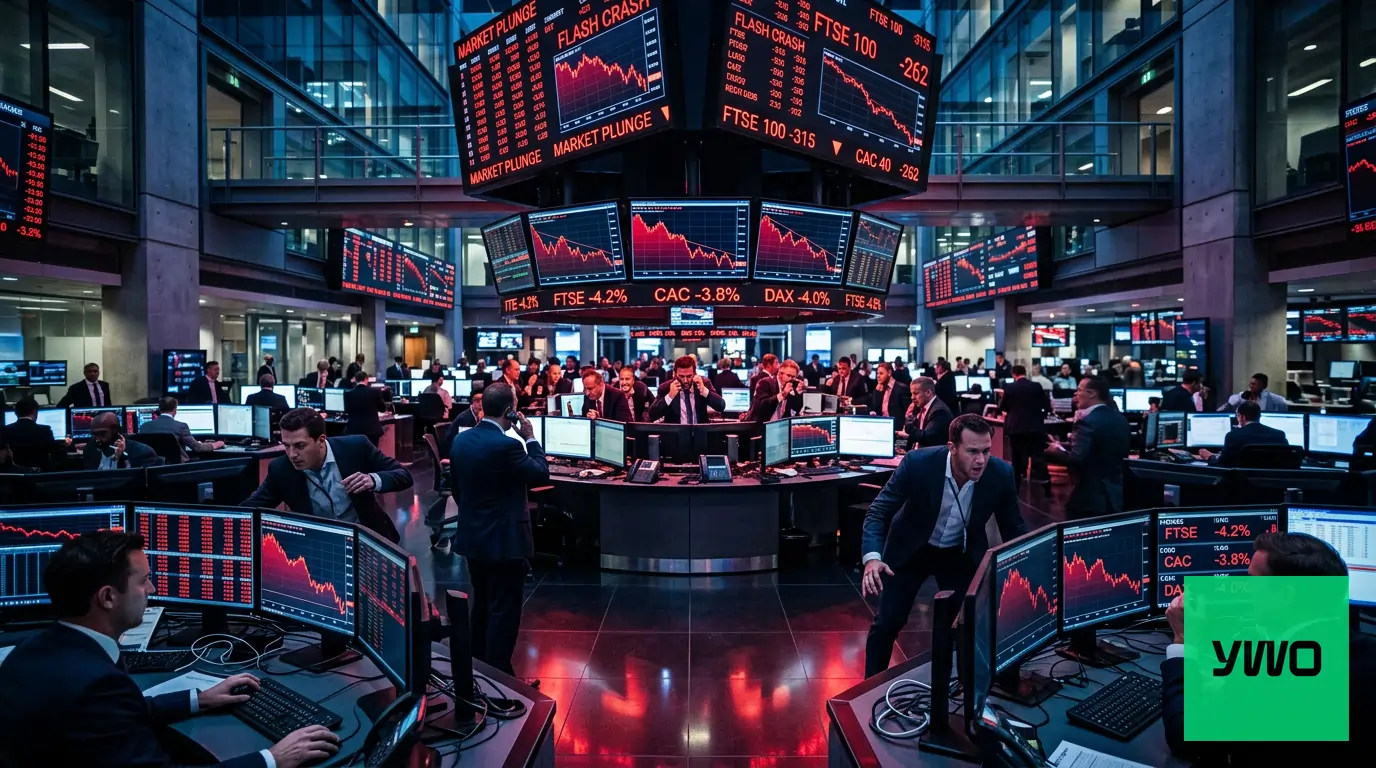
Global equity markets extended Monday’s tech-driven losses on Tuesday, with South Korea’s Kospi closing 10% lower and Nasdaq 100 futures dropping 2.7% in pre-market trading, CNBC’s Chloe Taylor reported. The session marked a second consecutive day of heavy selling in chip and mega-cap technology names, with losses spreading from Wall Street’s Monday close through Asian markets and into European trading.
The immediate epicentre was Seoul. Samsung and SK Hynix both fell more than 12%, dragging the Kospi — South Korea’s tech-heavy benchmark — to a 10% single-session loss, Taylor’s report showed. For context, those two names alone account for a substantial portion of the index’s market capitalisation, which meant their double-digit declines had an outsized mechanical effect on the headline number.
Chip Stocks Lead Declines Across Every Time Zone
The iShares Semiconductor ETF was down 6.2% in pre-market trading on Wall Street, according to CNBC. Micron led individual-stock losses at 8.5% lower, Intel fell 7.6%, and AMD shed 6.2%. Nvidia, the largest chip name by market cap, was 3% lower. The losses were not confined to memory or logic — the sell-off was broad across the semiconductor complex.
Europe tracked the damage. The pan-European Stoxx 600 fell around 1% by afternoon trading, paring steeper morning losses, while the Stoxx 600 Technology sub-index dropped 3%, CNBC reported. STMicroelectronics and Dutch semiconductor equipment maker ASMI were both down more than 7%, ranking among the index’s largest single-session movers.
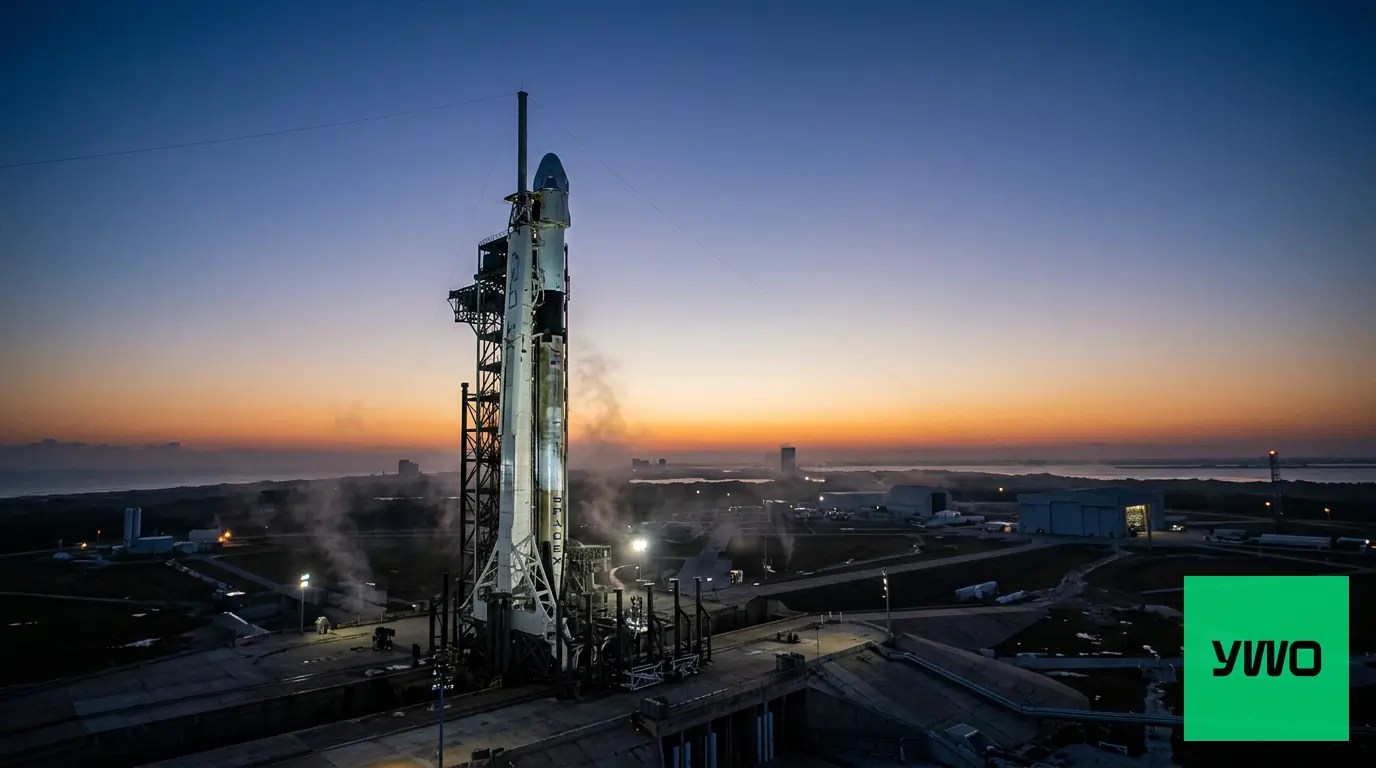
Reports of sharp valuation losses at SpaceX coincided with broader weakness across technology-related assets.
. After a steep decline during Monday’s session — a move CNBC’s reporting described as a significant valuation wipeout — SpaceX was said to have extended those losses further in secondary market activity on Tuesday, Taylor noted. That back-to-back decline made SpaceX one of the more visible anchors on the broader Magnificent Seven conversation, even as Amazon and Meta posted comparatively modest pre-market losses of just over 0.7% each.
| Asset / Index | Move | Session / Timing |
|---|---|---|
| South Korea Kospi | –10% | Tuesday close |
| Samsung | >–12% | Tuesday close |
| SK Hynix | >–12% | Tuesday close |
| Stoxx 600 | ~–1% | Tuesday afternoon |
| Stoxx 600 Technology | –3% | Tuesday afternoon |
| STMicroelectronics | >–7% | Tuesday |
| ASMI | >–7% | Tuesday |
| Nasdaq 100 futures | –2.7% | Pre-market Tuesday |
| iShares Semiconductor ETF | –6.2% | Pre-market Tuesday |
| Micron | –8.5% | Pre-market Tuesday |
| Intel | –7.6% | Pre-market Tuesday |
| AMD | –6.2% | Pre-market Tuesday |
| Nvidia | –3% | Pre-market Tuesday |
| SpaceX | Extended losses | Secondary market activity Tuesday (after sharp Monday decline) |
| Amazon | >–0.7% | Pre-market Tuesday |
| Meta | >–0.7% | Pre-market Tuesday |
Source: CNBC
Micron Earnings on Wednesday Are the Next Live Wire
Wedbush analyst Dan Ives addressed the sell-off directly in a Tuesday morning note. “Clearly this [downturn] will cause selling pressure and white knuckles for tech stocks in the U.S. this morning as investors worry the overheated KOSPI sell-off has a spillover impact to U.S. tech stocks,” he wrote, per CNBC. He flagged Micron’s earnings report, due Wednesday, as an amplifier of the current nervousness — a print that now carries considerably more weight given where Micron’s stock is trading ahead of it.
Ives, who manages Wedbush’s AI Revolution ETF — a fund with Micron, TSMC, and Nvidia among its top holdings — framed the session as one of several stress points he expects the AI trade to absorb. “Taking a step back we continue to believe that in this market we will continue to go through a number of ‘gut check moments’ in the tech trade as the AI Revolution remains in the 3rd inning… this morning is just another one of those moments,” he said, according to CNBC.
According to Ives, the long-term investment thesis surrounding AI-related spending remains unchanged, while he characterised the recent sell-off as being driven primarily by market sentiment and positioning. .
The Bull Case Gets a Stress Test
Not everyone was rattled. Tom Hulick, CEO of Strategy Asset Managers, told CNBC’s Squawk Box Europe on Tuesday that he saw no systemic threat in the price action. “I don’t think we’re anywhere near some type of catastrophic failure in the markets. There’s too much liquidity out there, and the earnings momentum is very strong right now,” he told the programme, per CNBC.
Hulick acknowledged that trillion-dollar AI capital expenditure cycles could push valuations to elevated levels — “stratospheric,” in his word — for names like SpaceX or Anthropic, but stopped short of calling those valuations a problem. Markets, he said, are “very fluid” right now.
The comments came after a session marked by significant declines across several technology-related assets. . A sharp single-session decline in SpaceX’s reported valuation, combined with the Mag 7 rotation that pulled the S&P 500 and Nasdaq Composite lower, underscored the scale of the recent market move. . .
Market participants will be closely monitoring Micron’s upcoming earnings release for additional information regarding conditions in the semiconductor sector. .
What’s Next
- Micron Technology earnings report — scheduled for Wednesday, 24 June 2026, after the U.S. market close. Given Micron’s 8.5% pre-market decline on Tuesday and its prominence in Wedbush’s AI Revolution ETF, the print carries elevated market significance. Check Investing.com for the confirmed time.
- U.S. market open, Tuesday 23 June — Nasdaq 100 futures were indicating a 2.7% lower open as of the pre-market window captured in CNBC’s reporting. The U.S. cash session will provide additional insight into how markets respond following the declines observed in futures trading
Risk Disclaimer: Trading CFDs involves substantial risk and may not be suitable for all investors. CFDs are complex instruments and come with a high risk of losing money rapidly due to leverage. You may lose some or all of your invested capital. You should consider whether you understand how CFDs work and whether you can afford to take the high risk of losing your money. Past performance is not a reliable indicator of future results. This article is provided for general informational and educational purposes only and does not constitute financial, investment, legal, tax, or trading advice, nor a recommendation, solicitation, or offer to buy or sell any financial instrument.