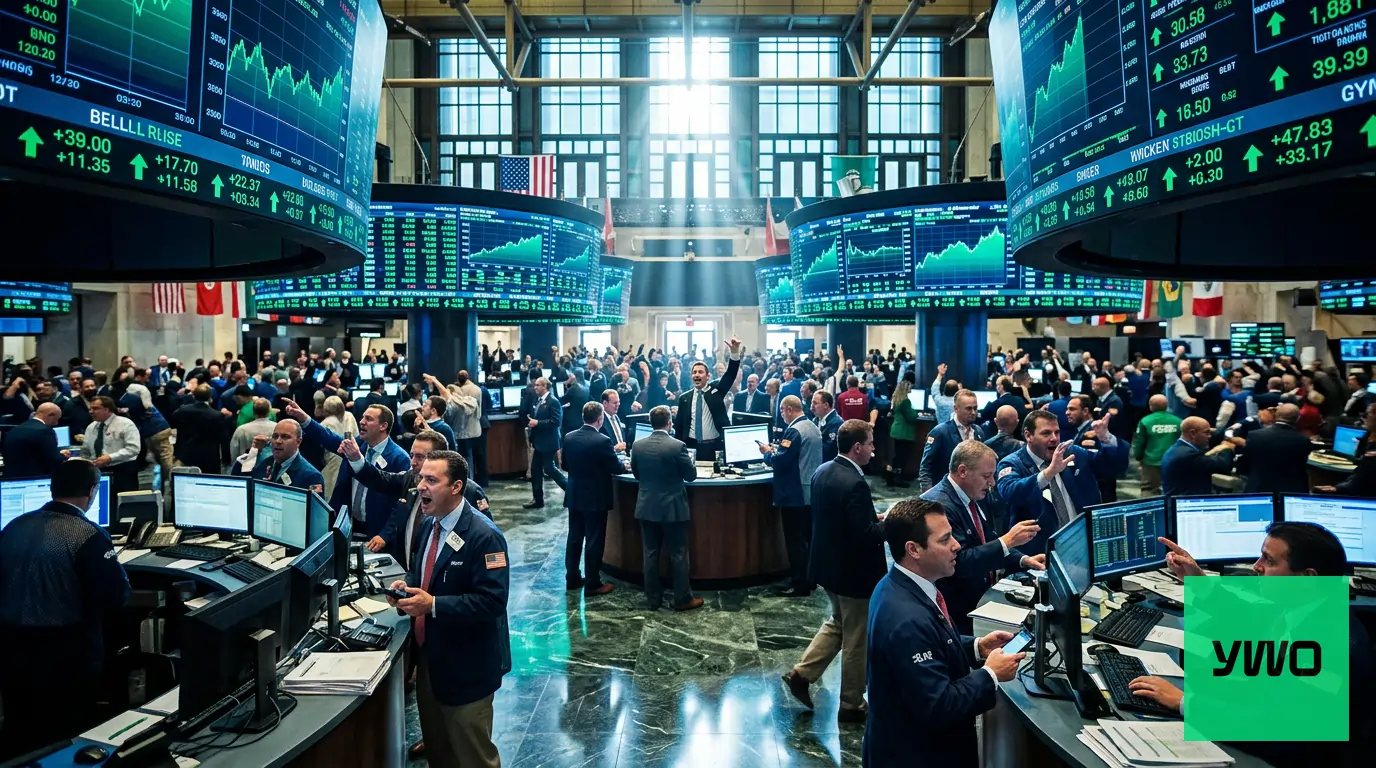
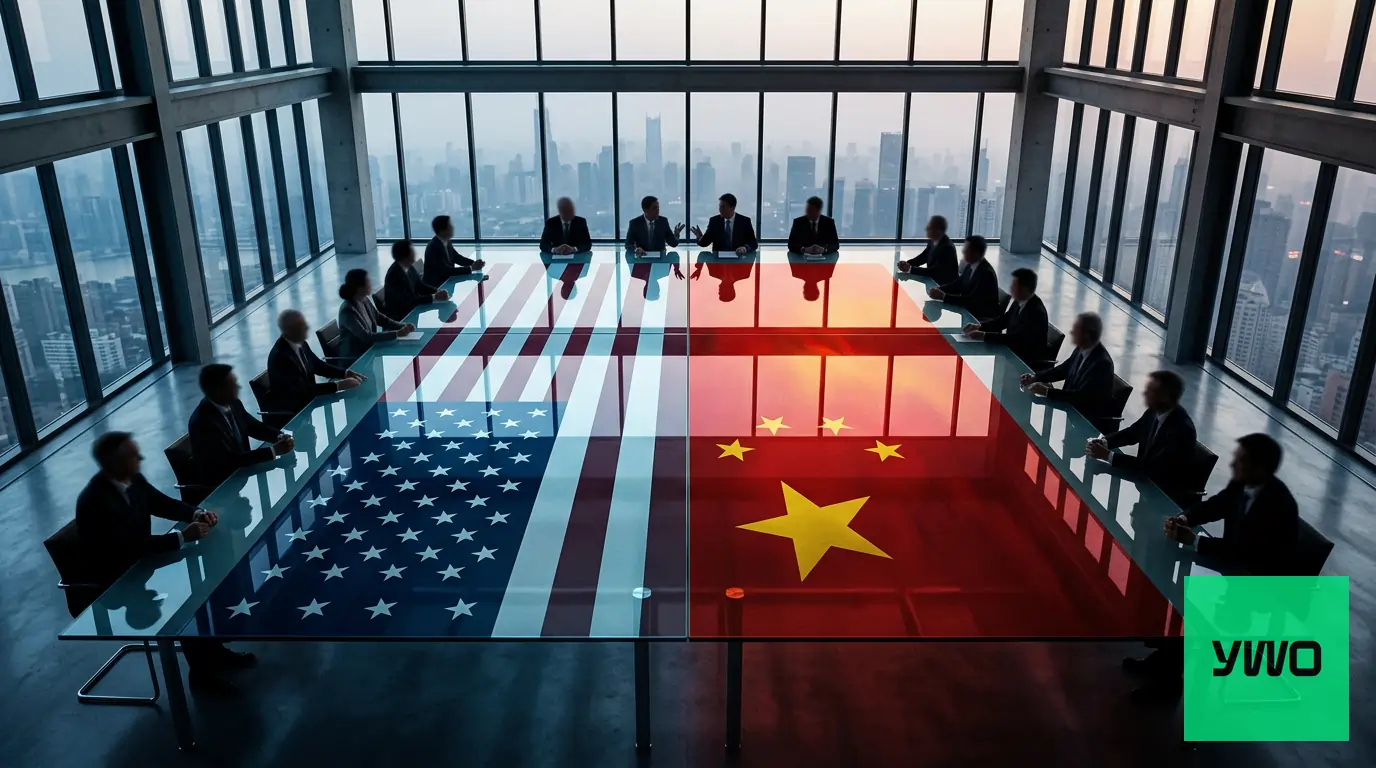
Author: Antonis

  • XRP Slides Toward $1.35 as Liquidation Wave Signals Weakening Support

    XRP Slides Toward $1.35 as Liquidation Wave Signals Weakening Support

    XRP-USD extended losses in late-session trading on Thursday, sliding toward the $1.35 level as a wave of leveraged position liquidations weighed on market sentiment, according to CoinDesk. The move has drawn attention to what traders are characterising as thinning support across the near-term price range.


    Context

    The decline comes amid broader crypto market softness, with elevated leverage across derivatives markets suggesting that positioning had become stretched ahead of the selloff. According to CoinDesk, the liquidation activity is being interpreted by some market participants as a sign that conviction among short-term holders may be waning.

    Rising open interest alongside falling prices has historically been associated with increased directional volatility in crypto markets, though analysts note that market relationships are dynamic and may change over time. Both bullish and bearish narratives remain active: some traders see the $1.35 zone as a potential area of historical interest, while others point to the pace of late-session selling as evidence that downside pressure could persist if leveraged long positions continue to unwind.

    Broader sentiment in digital asset markets has remained cautious, with macro uncertainty and risk-off conditions across equities potentially contributing to reduced appetite for higher-volatility assets, CoinDesk reported.


    Key Data

    • XRP-USD approaching the $1.35 level, according to CoinDesk
    • Liquidation volumes have been observed increasing during the late-session period
    • Rising leverage across derivatives markets noted ahead of the move
    • $1.35 has historically functioned as a reference level for market participants monitoring price action — this is observational and does not imply a guaranteed reaction
    • Downside risk is characterised as elevated given current market structure, though outcomes remain uncertain

    Market Snapshot

    AssetLevelChangeSource
    XRP-USD~$1.35DecliningCoinDesk
    Bitcoin (BTC-USD)CoinDesk
    EUR/USDReuters
    S&P 500 FuturesReuters
    Gold (XAU/USD)Reuters
    US 10Y YieldReuters

    Live pricing data may be sourced via TradingView and Investing.com.


    Events Ahead

    The following upcoming events may influence XRP-USD and broader crypto market conditions. They are presented as catalysts to monitor, not as predictive indicators:

    • US Macroeconomic Data Releases — Any significant shifts in risk sentiment driven by economic data may influence digital asset markets. Monitor via the Investing.com Economic Calendar
    • Federal Reserve Communications — Any further guidance from Fed officials on monetary policy could affect risk appetite across asset classes. See the Federal Reserve Events Calendar
    • Crypto Derivatives Expiry Dates — Scheduled options and futures expirations may contribute to short-term volatility in XRP and related assets. Check CME for regulated derivatives schedules
    • Broader Digital Asset Market Flows — Continued monitoring of Bitcoin and Ethereum price action may provide context for altcoin positioning. Track via CoinDesk and CoinTelegraph

    Risk Disclaimer: Trading CFDs involves substantial risk and may result in the loss of your invested capital. CFDs are complex instruments and come with a high risk of losing money rapidly due to leverage. You should consider whether you understand how CFDs work and whether you can afford to take the high risk of losing your money. Past performance is not indicative of future results. This content is for informational and educational purposes only and does not constitute investment advice.

  • Indian Rupee Falls to Fresh Record Low Amid Iran Geopolitical Tensions

    Indian Rupee Falls to Fresh Record Low Amid Iran Geopolitical Tensions

    The Indian rupee weakened to a new all-time low against the US dollar during Asian trading hours, as markets assessed the potential economic fallout from escalating geopolitical tensions linked to the Iran conflict. Broader Asian foreign exchange markets remained largely subdued, with market participants weighing diplomatic developments and their implications for regional risk appetite, according to Investing.com News.


    Context

    The rupee’s decline to historic lows appears to reflect a combination of factors that have been building across emerging market currencies in Asia. The Iran conflict has introduced a layer of geopolitical uncertainty that tends to weigh on higher-risk, import-dependent economies, particularly those with significant exposure to energy markets.

    India imports a substantial share of its crude oil requirements, making the economy structurally sensitive to disruptions in Middle Eastern supply chains. When geopolitical risk in the Gulf region rises, market participants 

    have historically reassigned capital away from currencies of oil-importing nations toward perceived safe-haven assets, including the US dollar. Market relationships of this kind are dynamic, however, and may change over time depending on the nature and duration of any conflict-related disruption.

    According to Reuters, broader sentiment across Asian currency markets has remained cautious as diplomats continue to navigate the Iran situation, with no clear resolution in sight at the time of publication. The muted tone across regional FX suggests market participants are not yet pricing in a definitive outcome — either an escalation or a de-escalation — which may contribute to increased sensitivity to headline-driven movements

    The Reserve Bank of India (RBI) has historically intervened in currency markets to manage excessive volatility in the rupee, though the central bank’s capacity and willingness to defend specific levels remains a point of ongoing analyst debate. Any such intervention, should it occur, may offer short-term support, though structural factors including India’s current account dynamics and global dollar strength continue to represent headwinds for the currency, according to Bloomberg.

    From a broader macro perspective, the US dollar has retained relative strength amid a global environment of geopolitical uncertainty. The dollar index has historically benefited from risk-off sentiment, and periods of elevated Middle Eastern tension have often — though not always — corresponded with broader dollar demand. Market relationships are dynamic and past correlations do not guarantee future performance.


    Key Data

    The following price levels and market observations are drawn from available market data and reporting. All technical levels are presented as observational context only and do not represent trading signals or recommendations.

    • USD/INR reached a new all-time high during the session, reflecting the rupee at a fresh record low, according to Investing.com News.
    • The USD/INR pair has been trading in a broadly elevated range for an extended period, with the rupee having depreciated meaningfully over the past twelve months against the dollar, according to Reuters.
    • Crude oil prices — a key macro variable for India’s external balance — have remained elevated amid Middle Eastern tensions, adding pressure to India’s import bill and, by extension, the current account deficit, according to Bloomberg.
    • Broader Asian FX markets showed muted movement overall, with most regional currencies trading in narrow ranges as traders awaited further diplomatic clarity, per Investing.com News.
    • The US Dollar Index (DXY) has held firm in recent sessions, underpinned by safe-haven demand and relative US economic resilience, according to MarketWatch.

    From a purely observational standpoint, the USD/INR pair has historically found periods of consolidation following sharp record-setting moves, though momentum and external drivers may extend or reverse such moves unpredictably. Technical levels observed by market analysts have historically acted as reference points for price action, but do not represent reliable predictors of future direction.


    Market Snapshot

    The following table reflects approximate market levels and directional moves observed during the relevant trading session. Data is sourced from public market reporting and should be treated as indicative only.

    AssetLevel (Approx.)DirectionSource
    USD/INRRecord highHigher (INR weaker)Investing.com
    US Dollar Index (DXY)FirmStable/Slightly higherMarketWatch
    EUR/USDMixedRange-boundReuters
    USD/JPYElevatedStableReuters
    Crude Oil (Brent)ElevatedSupportedBloomberg
    Gold (XAU/USD)FirmSupported by risk-off toneReuters
    Asian Equity IndicesMixedMutedCNBC
    US Treasury YieldsStableRange-boundBloomberg

    Note: Levels are indicative and subject to change. Market conditions may shift rapidly in response to geopolitical developments.


    The Bull and Bear Case for INR

    Factors that may support the rupee (bull case):

    • A diplomatic resolution or de-escalation in the Iran conflict could reduce risk-off sentiment across emerging market currencies, potentially easing pressure on the rupee.
    • The RBI has historically demonstrated a willingness to intervene in the foreign exchange market to manage disorderly moves, which may act as a stabilising factor.
    • India’s longer-term economic growth trajectory, including strong domestic consumption and a growing services export sector, provides a degree of structural support to rupee demand over time.
    • A softening in global crude oil prices — should geopolitical tensions ease — could improve India’s import dynamics and current account outlook, which analysts have historically linked to rupee performance. Market relationships are dynamic and may change over time.

    Factors that may weigh on the rupee (bear case):

    • A prolonged or escalating Iran conflict may sustain or increase crude oil prices, widening India’s current account deficit and sustaining downward pressure on the rupee.
    • Persistent US dollar strength, driven by Federal Reserve policy expectations and global safe-haven demand, may continue to exert broad pressure on emerging market currencies including the rupee.
    • Domestic inflationary pressures, if sustained, may complicate the RBI’s monetary policy calculus, potentially limiting the central bank’s flexibility in managing currency volatility.
    • Capital outflow dynamics from emerging markets during periods of elevated global uncertainty have historically weighed on currencies such as the rupee, though such patterns are not guaranteed to repeat, according to Bloomberg.

    Events Ahead

    The following scheduled and potential events may be relevant to INR and broader Asian FX markets. These are presented as items to monitor and not as predictors of market direction.

    • US Federal Reserve Communications: Any further guidance on the interest rate outlook from Federal Reserve officials may influence dollar strength and, by extension, emerging market currency dynamics. Market Participantscan monitor scheduled Fed events via the Federal Reserve Events Calendar.
    • Iran Diplomatic Developments: Ongoing diplomatic activity related to the Iran conflict remains the primary near-term catalyst for sentiment shifts in Asian FX. No fixed calendar date applies; developments may emerge at any time.
    • Reserve Bank of India Policy Stance: Any formal communication or intervention activity from the RBI regarding the rupee may be a significant market event. The RBI’s next scheduled policy meeting will be watched closely by analysts.
    • India CPI and Trade Data: Upcoming Indian inflation and trade balance releases may provide fresh context on the rupee’s fundamental drivers. Traders can track scheduled data releases via the Investing.com Economic Calendar.
    • US Economic Data (CPI, NFP, GDP): Major US macroeconomic releases that influence Federal Reserve expectations could affect dollar strength and, in turn, USD/INR direction. Relevant releases can be tracked via the Investing.com Economic Calendar.
    • Crude Oil Supply and Inventory Data: Given India’s sensitivity to energy import costs, EIA weekly inventory reports and OPEC-related developments may be relevant to rupee sentiment. Weekly data is available via the EIA.
    • Broader Geopolitical Calendar: G7, UN, or bilateral diplomatic meetings concerning Iran and Middle Eastern stability may generate market-moving headlines. Monitoring international news sources is advisable.

    Risk Disclaimer: Trading CFDs involves substantial risk and may result in the loss of your invested capital. CFDs are complex instruments and come with a high risk of losing money rapidly due to leverage. You should consider whether you understand how CFDs work and whether you can afford to take the high risk of losing your money. Past performance is not indicative of future results. This content is for informational and educational purposes only and does not constitute investment advice.

  • Oil Prices Decline as Iran Allows 10 Tankers Through Strait of Hormuz

    Oil Prices Decline as Iran Allows 10 Tankers Through Strait of Hormuz

    Oil prices moved lower on Thursday after U.S. President Donald Trump announced that Iran had permitted 10 oil tankers to transit the Strait of Hormuz, describing the development as a “present,” according to CNBC. The news offered modest relief to energy markets that had been pricing in elevated geopolitical risk premiums tied to the Middle East conflict.


    Context

    The Strait of Hormuz is one of the world’s most strategically significant maritime chokepoints, with an estimated 20% of global oil supply transiting the waterway, according to Reuters. Any perceived reduction in disruption risk may weigh on the geopolitical premium embedded in crude prices, though analysts caution that a single diplomatic signal does not resolve underlying tensions.

    According to CNBC, markets interpreted Iran’s move as a constructive, if limited, gesture. Analysts note that the broader geopolitical environment remains uncertain, and supply-side factors — including OPEC+ production decisions and U.S. inventory data — continue to shape the medium-term outlook for crude.

    Bearish participants may point to the tanker passage as evidence that supply disruption fears were overstated, while more cautious observers note that Iran’s posture toward the strait has historically fluctuated and that the diplomatic situation remains fluid. Market relationships are dynamic and may change over time.


    Key Data

    • WTI Crude: Declined following the announcement, according to CNBC
    • Brent Crude: Also moved lower in tandem with WTI, per CNBC
    • USO (U.S. Oil ETF): Tracked the broader decline in crude benchmarks, per Reuters
    • Recent EIA weekly inventory data remains a key reference point for near-term price direction, according to the EIA

    Current price levels may serve as near-term reference points for market participants. Past price behaviour does not guarantee future outcomes.


    Market Snapshot

    AssetDirectionNoteSource
    WTI CrudeLowerDeclined on reduced disruption riskCNBC
    Brent CrudeLowerTracked WTI moveCNBC
    USOLowerReflected crude benchmark weaknessReuters
    USDMixedGeopolitical relief may influence safe-haven flowsReuters
    Energy EquitiesMixedSector sentiment tied to crude directionMarketWatch

    Market relationships are dynamic and may change over time. Past correlations do not guarantee future performance.


    Events Ahead

    Traders and analysts may be monitoring the following upcoming catalysts:

    • EIA Weekly Petroleum Status Report — Inventory builds or draws could influence near-term crude price direction; see EIA for release schedule
    • OPEC+ Production Policy — Any guidance on output levels may affect the supply outlook; updates via Reuters
    • U.S.-Iran Diplomatic Developments — Further signals regarding Hormuz access or nuclear negotiations could shift geopolitical risk pricing; tracked via CNBC
    • U.S. Macro Data — Broader economic indicators may influence energy demand expectations; calendar available at Investing.com

    Risk Disclaimer: Trading CFDs involves substantial risk and may result in the loss of your invested capital. CFDs are complex instruments and come with a high risk of losing money rapidly due to leverage. You should consider whether you understand how CFDs work and whether you can afford to take the high risk of losing your money. Past performance is not indicative of future results. This content is for informational and educational purposes only and does not constitute investment advice.

  • SpaceX IPO Filing Reportedly Imminent, Targeting $75 Billion Raise

    SpaceX IPO Filing Reportedly Imminent, Targeting $75 Billion Raise

    Shares of space-sector equities moved higher in premarket trading on reports that SpaceX is preparing to file for an initial public offering that could raise more than $75 billion, according to The Information, as reported by MarketWatch at 13:19 UTC. If completed at the reported target size, the offering would rank among the largest IPOs in market history.


    Context

    According to MarketWatch, the reported filing has drawn significant market attention given SpaceX’s scale and the relatively limited number of publicly traded pure-play space companies available to investors.

    A SpaceX public listing, if it proceeds as reported, could materially reshape how institutional and retail capital is allocated across the broader space sector. Market participants appear to be reassessing the relative value of existing listed space-sector equities, as a liquid, large-cap SpaceX vehicle might alter demand dynamics for smaller peers. Analysts have noted that outcomes of this nature tend to generate both rotation opportunities and valuation recalibration across adjacent names, though market relationships are dynamic and may change over time.

    The reported raise would value SpaceX at a scale comparable to some of the largest technology companies, according to Bloomberg, which has previously reported SpaceX valuations in the range of $350 billion based on secondary market transactions and tender offers. Past valuation benchmarks from private transactions do not guarantee any future public market pricing.


    Key Data

    • Reported IPO raise target: More than $75 billion, per The Information via MarketWatch
    • EchoStar (SATS): Moved higher in premarket trading following the report, per MarketWatch
    • Rocket Lab USA (RKLB): Among space-sector equities noted for premarket movement, per MarketWatch
    • Iridium Communications (IRDM): Listed among related equities under observation, per MarketWatch
    • Astra Space (ASTR): Also tracked in the premarket session, per MarketWatch

    Current intraday price levels for the above equities may be tracked via Investing.com and Bloomberg Markets.


    Market Snapshot

    AssetLevelChangeSource
    SATS (EchoStar)Premarket upPositiveMarketWatch
    RKLB (Rocket Lab)Premarket upPositiveMarketWatch
    IRDM (Iridium)Under watchTBCInvesting.com
    ASTR (Astra Space)Under watchTBCInvesting.com
    S&P 500 FuturesLive dataTBCCME Group
    Nasdaq 100 FuturesLive dataTBCCME Group

    Live pricing should be verified directly with data providers. Levels above reflect premarket conditions at time of reporting and may have changed.


    Bull and Bear Perspectives

    Bull case: A SpaceX listing could validate the commercial space sector at scale, potentially increasing institutional interest in the broader category. Existing listed peers may benefit from heightened investor attention toward the sector, according to analysts cited by Bloomberg.

    Bear case: A large, liquid SpaceX public vehicle might draw capital away from smaller listed space-sector names, as investors could favour the larger, more established operator. Valuation compression in adjacent equities has historically followed large-cap entrants in comparable technology sub-sectors.


    Events Ahead

    Market participants may wish to monitor the following upcoming catalysts:

    • SpaceX formal S-1 or IPO prospectus filing — timing unconfirmed; to be monitored via SEC EDGAR
    • RKLB earnings and guidance updates — schedule to be confirmed via Investing.com Earnings Calendar
    • IRDM quarterly results — schedule to be confirmed via Investing.com Earnings Calendar
    • Broader US equity market open — S&P 500 and Nasdaq reaction to the report at the cash session open, tracked via CME Group
    • Federal Reserve communications and macro data — any shifts in risk sentiment may influence growth-oriented equity sectors; calendar via Investing.com Economic Calendar

    Risk Disclaimer: Trading CFDs involves substantial risk and may result in the loss of your invested capital. CFDs are complex instruments and come with a high risk of losing money rapidly due to leverage. You should consider whether you understand how CFDs work and whether you can afford to take the high risk of losing your money. Past performance is not indicative of future results. This content is for informational and educational purposes only and does not constitute investment advice.

  • Trading Inflation: Assets That Perform When Prices Rise

    Trading Inflation: Assets That Perform When Prices Rise

    The financial landscape of 2026 is defined by a singular, undeniable reality. Inflation is not a transitory ghost that central banks can easily exorcise. It has cemented itself as a structural feature of the global economy.

    Rising prices can affect purchasing power and influence investment outcomes. For market participants, inflation represents a macroeconomic variable that can be monitored and analysed alongside other economic indicators

    Navigating this environment involves reassessing approaches that were more common during periods of low interest rates. The playbook has changed entirely. When the cost of capital was essentially free, virtually every asset class moved higher in unison.

    Today, the market is a highly selective arena. Capital flows rapidly away from vulnerable sectors and directly into assets engineered to thrive under pressure.

    This comprehensive guide serves as the ultimate cluster article for trading inflation. It connects the critical concepts explored in our foundational pillar articles and builds a unified strategy for the current market cycle. The discussion includes an overview of economic data relevant to central bank policy, market sentiment and sector rotation, as well as the role of commodities in inflationary environments. It also considers the potential implications of stagflation scenarios

    The aim is not merely to survive the current economic climate. The aim is to provide an overview of how different asset classes have behaved during periods of rising prices, and how inflation can influence market dynamics across sectors

    Decoding the Data: CPI vs PCE Explained

    To understand how inflation influences markets, it is important to consider how it is measured. The global financial system does not react to the actual cost of groceries at the local supermarket. It reacts to specific data points published by government agencies. The two most critical metrics in this space are the Consumer Price Index and the Personal Consumption Expenditures price index.

    While both indices attempt to measure the same underlying economic phenomenon, they do so using vastly different methodologies. Understanding this divergence  can provide additional context when analysing market reactions.

    The Consumer Price Index:

    The metric most frequently quoted by the mainstream financial media. It is calculated by tracking a fixed basket of goods and services over time. This fixed nature is its commonly discussed limitation. The index assumes that consumers will continue to buy the exact same items regardless of how expensive they become.

    Furthermore, the index assigns a massive weighting to housing costs, specifically utilizing a controversial metric known as owner’s equivalent rent. This metric relies on survey data asking homeowners what they believe their house would rent for, which often introduces a significant lag and subjective bias into the data.​

    The Personal Consumption Expenditures Index, conversely, is the preferred gauge of the Federal Reserve. It provides a broader and  more dynamic picture of the economy.

    The primary advantage of the Federal Reserve:

    Preferred metric is that it accounts for the substitution effect. This is a fundamental concept in behavioural economics. If the price of beef skyrockets due to a supply chain disruption, rational consumers will not simply continue buying the same amount of beef. They will substitute that expensive protein with a cheaper alternative, such as chicken. The dynamic weighting of the data captures this shift in real time, providing a more accurate reflection of actual consumer spending habits.​

    Additionally, this metric includes expenditures made on behalf of the consumer, such as healthcare costs covered by employer-sponsored insurance programs. This broader scope makes it a superior tool for macroeconomic forecasting.

    Because of these profound methodological differences, the two metrics rarely align perfectly. Historically, the fixed basket approach tends to run roughly four-tenths of a percentage point hotter than the dynamic model. In early 2026, core readings for the central bank preferred gauge hovered around 3.1 percent, indicating that while hyperinflation has been avoided, structural pricing pressures remain stubbornly entrenched.

    For the active trader:

    This discrepancy creates an opportunity. The algorithmic trading bots that dominate modern finance frequently overreact to a hot print in the media-focused index.

    A sophisticated participant who understands that the central bank relies on the smoother, lower data point can fade these algorithmic panic spikes. They can buy the temporary dip in equities, knowing that the actual policymakers are observing a far less alarming dataset. Understanding CPI vs. PCE and which inflation data matters more to the Fed is the absolute foundation of institutional inflation trading.

    The Great Rotation: Consumer Staples vs Discretionary Stocks

    When the underlying data confirms that inflation is accelerating, market participants may adjust their exposure across different sectors. This process is often referred to as sector rotation. The most critical battleground during an inflationary cycle is the dividing line between what consumers want and what consumers need.

    To grasp this concept, one must view the economy through the lens of a highly stressed household budget. When the cost of fuel, electricity, and basic nutrition rises dramatically, the average consumer experiences a severe contraction in their disposable income. Their paycheck remains the same size, but it buys significantly less.

    This shift can influence consumer behaviour, with discretionary spending potentially reduced. The consumer instantly eliminates all unnecessary spending. They canceled the planned luxury vacation. They delay the purchase of a new television. They stop dining out at expensive restaurants.

    The companies that provide these non-essential goods and services belong to the Consumer Discretionary sector. During an inflationary spike, this sector may face multiple challenges. Rising input costs can increase operational expenses, while reduced consumer spending may affect revenues. These factors can place pressure on profit margins and influence company performance

    Conversely, the same consumer who just cancelled their luxury vacation is still required to purchase toothpaste, toilet paper, and basic medical supplies. These items are entirely non-negotiable.

    The companies that manufacture these essential items belong to the Consumer Staples sector. These massive, globally diversified corporations possess the ultimate weapon against inflation. They possess pricing power.

    Because the demand for their products is highly inelastic, they can easily pass their rising production costs directly onto the consumer. If a major manufacturer raises the price of their essential laundry detergent by ten percent, the consumer will complain bitterly, but they will still put the item in their shopping cart. They have no other viable option.

    Furthermore, these sophisticated corporations frequently employ a tactic known as shrinkflation. Rather than raising the absolute price of a product, they simply reduce the volume of the product contained within the packaging. The price remains the same, but the consumer receives ten percent less cereal in the box. This optical illusion protects corporate profit margins while shielding the consumer from the immediate psychological shock of a higher price tag.

    Market participants may monitor indicators such as the yield curve and input costs when assessing sector performance during inflationary periods. In some cases, shifts in capital allocation between discretionary and staples sectors have been observed, reflecting changes in consumer spending patterns. During such periods, essential goods may exhibit more stable demand compared to discretionary products.

    The Industrial Engine: Why Silver is the Poor Man’s Gold During Inflation

    While equities offer a theoretical hedge against rising prices, physical commodities are sometimes considered as part of inflation-related discussions. During periods of monetary expansion, some assets have historically experienced upward price movements

    Gold is the traditional champion of this arena. It is often regarded as a store of value, hoarded by central banks and ultra-wealthy investors as insurance against systemic collapse. However, for the active participant seeking aggressive capital appreciation rather than mere wealth preservation, gold is often too slow and too heavy.

    The sophisticated alternative is silver.

    Silver occupies a unique space in the global financial ecosystem. It suffers from an intense dual identity. It is simultaneously a precious monetary metal and a highly critical industrial component. This schizophrenic nature makes its price action incredibly volatile and incredibly lucrative for those who understand its mechanics.

    The monetary argument for this asset is straightforward. Like its yellow sibling, it cannot be printed into existence by a desperate government. It requires massive amounts of capital, heavy machinery, and human labor to extract from the earth. When the purchasing power of fiat currency drops, the nominal price of the metal must rise to reflect its true underlying value. It has served as reliable money for thousands of years, earning the moniker of the poor man’s gold due to its historically lower barrier to entry.

    However, the true explosive potential of this asset in 2026 is driven entirely by its industrial application. Silver is the most electrically conductive element on the periodic table. There is no synthetic substitute that can match its performance.

    This physical property places the metal directly at the absolute center of the modern technological revolution. The explosive proliferation of artificial intelligence has triggered a massive global arms race to construct advanced data centers. These sprawling facilities require unimaginable amounts of electricity and highly sophisticated thermal management systems. The structural infrastructure of these AI engines relies heavily on advanced electronics, all of which require significant amounts of physical silver.​

    Simultaneously, the global push toward renewable energy continues to accelerate. Photovoltaic solar panels require massive quantities of the metal to function efficiently. The electric vehicle industry is consuming vast amounts of the element for battery management systems and onboard computing grids.

    This perfect storm of unrelenting industrial demand has collided violently with a stagnant global supply. The mining sector has suffered from a decade of chronic underinvestment. Discovering a new deposit, securing the necessary environmental permits, and constructing a functional mine is a process that takes more than ten years. You cannot simply turn on a faucet and create more supply to meet the sudden demand for artificial intelligence.

    This fundamental mismatch between exploding demand and constrained supply resulted in a historic price shock. The metal surged an astonishing 147 percent during the 2025 calendar year, shattering resistance levels that had held firm for over a decade. This momentum did not stall as the calendar turned. In the opening weeks of 2026, the asset violently surged another 25 percent. . Past performance, however, is not indicative of future results, and price movements may vary depending on market conditions

    Understanding why silver is the ‘poor man’s gold’ during inflation, requires acknowledging its high beta nature. When precious metals enter a confirmed bull market, silver has, at times, exhibited higher price variability compared to gold during certain market conditions. Its price movements can be more pronounced due to its dual role as both a monetary and industrial metal.

    Stagflation Risks: Understanding a Complex Economic Scenario

    While persistent, elevated inflation is difficult to manage, it is not the worst-case scenario for the global economy. If prices are rising but economic growth remains robust, corporations can still generate impressive profits, and the labor market remains healthy.

    The true nightmare scenario, the macroeconomic environment that terrifies central bankers and portfolio managers alike, is stagflation.

    Stagflation is an economic paradox. It is a combination of stagnant economic growth, higher unemployment, and rising consumer prices. According to traditional Keynesian economic theory, this combination should be mathematically impossible. If the economy is slowing and people are losing their jobs, demand should collapse, which should naturally force prices lower.

    However, the 1970s proved that this theoretical impossibility is a very harsh reality. When external supply shocks, such as an energy crisis or massive geopolitical conflict, artificially constrain the supply of essential goods, prices may increase significantly regardless of how weak the underlying consumer demand happens to be.

    In 2026, the global financial system is acutely aware of the stagflation risks and what happens if growth slows, but prices rise narrative. The structural fragmentation of the global supply chain, combined with shifting trade tariffs and persistent service sector inflation, has created a highly fragile environment.​

    The danger of this scenario is that it can challenge the traditional foundational pillars of modern investing. The standard portfolio is built upon a sixty percent allocation to equities and a forty percent allocation to bonds. This structure assumes an inverse correlation. When stocks fall during a recession, central banks cut interest rates, which causes bond prices to rise, protecting the overall portfolio balance.

    Stagflation shatters this correlation. Because inflation is running incredibly hot, the central bank is completely paralyzed. They cannot cut interest rates to stimulate the dying economy, because doing so would pour gasoline on the inflationary fire. They are forced to keep interest rates elevated, or even raise them, right into the teeth of a brutal recession.

    This environment may result in both equities and bonds experiencing periods of weakness, as rising costs can affect corporate earnings while higher interest rates influence bond valuations.

    In such conditions, market participants may explore how different asset classes respond to inflation and economic slowdown

    Treasury Inflation-Protected Securities become essential. These unique government bonds are designed to adjust their principal value in line with inflation measures, which may help reflect changes in purchasing power.

    In some stagflationary scenarios, commodities and energy-related sectors have been closely linked to supply conditions and pricing dynamics, reflecting their role in the broader economy.

    Building a Resilient Architecture

    The transition into the latter half of the decade may involve reassessing traditional approaches to wealth management. Assumptions around prolonged low interest rates and consistent central bank intervention have been increasingly questioned in recent market conditions

    In this environment, hope is not a valid strategy. A portfolio built on the assumption of a return to zero percent interest rates and non-existent inflation may be exposed to changing economic dynamics.

    Resilience may involve ongoing portfolio assessment and an understanding of evolving economic conditions, including differences between key data metrics and sector dynamics. In some cases, shifts in consumer behaviour and industrial demand have been associated with changes in sector performance

    Different asset classes may respond differently to inflationary environments, with some historically showing sensitivity to price changes and economic conditions. Understanding how inflation influences asset behaviour may provide additional context when evaluating market trends.

    Market relationships are dynamic and may change over time. Past correlations do not guarantee future performance. Trading involves significant risk and may not be suitable for all investors. Capital is at risk.

    How heavily is your current portfolio weighted toward discretionary consumer goods versus essential household staples?

    Final Reminder. Risk Never Sleeps: Trading involves risk and may not be suitable for all investors. This content is for educational and  informational purposes only and does not constitute investment advice or a recommendation.

  • European Stocks Rise as Oil Retreats on Ceasefire Optimism

    European Stocks Rise as Oil Retreats on Ceasefire Optimism

    European equity markets moved broadly higher on Wednesday as oil prices declined amid reports of progress in ceasefire negotiations involving the United States and Iran, according to Investing.com. The softer energy price environment appeared to improve risk sentiment across the region, with major indices posting gains in mid-session trade.


    Context

    Lower crude prices have historically been viewed as a potential tailwind for energy-importing economies within the eurozone, where elevated commodity costs have weighed on growth outlooks throughout recent quarters. According to Reuters, market participants are interpreting the ceasefire developments as a factor that could ease near-term inflationary pressure on European businesses and consumers, though analysts caution that diplomatic situations remain fluid and outcomes are uncertain.

    The European Central Bank has previously flagged energy price volatility as a material risk to the region’s disinflation path, as noted in its latest economic bulletin. Any sustained reduction in energy costs could, in theory, provide some relief to that outlook — though economists warn that geopolitical situations can reverse rapidly, and markets may be pricing in an outcome that has not yet been confirmed.

    Bearish observers note that European growth fundamentals remain under pressure from weak manufacturing data, sluggish consumer demand, and ongoing uncertainty around global trade conditions, as highlighted in recent Eurostat releases. A ceasefire development alone may not be sufficient to materially alter the region’s medium-term trajectory, some analysts suggest.


    Key Data

    • The EZU (iShares MSCI Eurozone ETF) was tracking higher in Wednesday’s session, reflecting broad eurozone equity strength, per Bloomberg Markets
    • Brent Crude eased on diplomatic headlines, with price levels tracked via TradingView
    • The DAX (Germany) showed gains, with the index observed near recent range highs, according to Investing.com
    • The CAC 40 (France) also advanced, per MarketWatch
    • The FTSE 100 (UK) posted a more modest move, reflecting the index’s higher weighting of energy sector constituents, which may see earnings headwinds from lower oil prices, according to Financial Times Markets
    • The EURO STOXX 50 moved higher, with levels tracked via Euronext

    Note: Market relationships are dynamic and may change over time. Past correlations between oil prices and equity performance do not guarantee future results.


    Market Snapshot

    AssetLevelChangeSource
    DAX~24,000 areaPositiveInvesting.com
    CAC 40~7,700 areaPositiveMarketWatch
    FTSE 100~8,700 areaModest PositiveFT Markets
    EURO STOXX 50~5,300 areaPositiveEuronext
    EZU ETFNear session highsPositiveBloomberg
    Brent CrudeRetreatingNegativeTradingView
    EUR/USD~1.08–1.09 rangeModest moveReuters
    German 10Y Bund YieldWatchingMixedBloomberg

    Levels are indicative. Readers should consult live data providers for real-time pricing.


    Events Ahead

    The following upcoming events may attract market attention and could influence European equity and energy sentiment. These are observational catalysts, not predictive signals:

    • US-Iran diplomatic developments — Any updates on ceasefire negotiations may continue to influence oil price direction and, by extension, European equity sentiment; tracked via Reuters World News
    • ECB speakers — Any scheduled remarks from ECB officials could provide further context on the bank’s view of energy prices and the growth outlook; calendar available via Investing.com Economic Calendar
    • Eurozone economic data releases — Upcoming PMI, inflation, or GDP figures may offer insight into whether lower energy costs are translating into improved economic conditions; tracked via Eurostat and Investing.com
    • OPEC+ communications — Any response from OPEC+ members regarding production policy in the context of ceasefire developments could affect crude price direction; monitored via Reuters Energy
    • US CPI / Fed communications — US inflation data and Federal Reserve commentary may influence broader global risk appetite and indirectly affect European markets; scheduled dates available at CME FedWatch and Investing.com

    Risk Disclaimer: Trading CFDs involves substantial risk and may result in the loss of your invested capital. CFDs are complex instruments and come with a high risk of losing money rapidly due to leverage. You should consider whether you understand how CFDs work and whether you can afford to take the high risk of losing your money. Past performance is not indicative of future results. This content is for informational and educational purposes only and does not constitute investment advice.

  • Iran Rejects US Ceasefire Overture, Contradicting Trump’s Negotiation Claims

    Iran Rejects US Ceasefire Overture, Contradicting Trump’s Negotiation Claims

    Iran’s state media reported on Monday that the Islamic Republic will not accept a US-proposed ceasefire, directly contradicting President Donald Trump’s assertion that the two nations are “in negotiations right now,” according to CNBC. The conflicting signals injected fresh uncertainty into geopolitical risk sentiment, with energy and safe-haven assets among the most closely watched markets in early trading.


    Context

    The messaging disconnect between Washington and Tehran represents a significant escalation in diplomatic ambiguity. According to CNBC, Iran’s state broadcaster flatly denied that any formal ceasefire talks are underway, while President Trump maintained publicly that negotiations are active. Analysts note that such contradictions may prolong uncertainty premiums embedded in crude oil and precious metals markets.

    Reuters has reported that Middle East tensions have remained elevated following recent military exchanges in the region, with oil supply routes through the Strait of Hormuz under continued scrutiny. The Strait of Hormuz handles an estimated 20% of global oil trade, according to the US Energy Information Administration, making any perceived supply disruption risk a persistent driver of crude price volatility.

    Markets are also weighing the broader implications for US foreign policy credibility. Analysts at Goldman Sachs Research have previously noted that unresolved Middle East conflicts tend to sustain a geopolitical risk premium in oil markets, though the magnitude may vary depending on the perceived proximity of direct supply disruption.


    Key Data

    • Crude Oil (CL=F): Front-month WTI crude has historically shown sensitivity to Strait of Hormuz risk narratives, with price levels and intraday moves tracked via CME Group.
    • Gold (GLD/XAU/USD): Spot gold has functioned as a traditional safe-haven asset during periods of elevated geopolitical uncertainty, per World Gold Council research. Current levels are observable via TradingView.
    • US Treasuries (TLT): Demand for long-duration US government bonds may rise in risk-off episodes; 10-year yield data is available via the US Treasury Department.
    • S&P 500 (SPY): Equity index futures could face modest pressure if risk-off sentiment persists, with real-time levels tracked via Bloomberg Markets.

    Market relationships are dynamic and may change over time. Past correlations do not guarantee future performance.


    Market Snapshot

    AssetLevelChangeSource
    WTI Crude (CL=F)See live dataElevated volatility flaggedCME Group
    Gold Spot (XAU/USD)See live dataSafe-haven demand notedTradingView
    S&P 500 Futures (ES)See live dataSentiment-drivenBloomberg
    10-Yr US Treasury YieldSee live dataRisk-off flows possibleUS Treasury
    USD/CADSee live dataOil-linked FX to watchReuters FX
    USO (Oil ETF)See live dataEnergy proxyMarketWatch

    Note: Live price levels shift continuously. Readers are encouraged to verify current data via the linked sources. Market relationships are dynamic and may change over time.


    Bull and Bear Perspectives

    Bull case for crude and gold: Traders may continue pricing in a geopolitical risk premium if the diplomatic impasse persists or escalates. Historically, prolonged uncertainty in the Middle East has tended to support energy prices and safe-haven assets, according to EIA analysis.

    Bear case: Should back-channel diplomacy resume or a de-escalation signal emerge from either side, the risk premium currently embedded in crude oil prices could unwind, potentially weighing on energy-linked assets. Reuters notes that diplomatic situations of this nature have historically seen rapid reversals.


    Events Ahead

    Markets may look to the following catalysts for further direction:

    • US–Iran diplomatic developments: Any official statement from the State Department or Iranian Foreign Ministry could shift sentiment rapidly. Monitor Reuters Middle East for updates.
    • EIA Weekly Crude Inventories: Scheduled release provides supply-side context for crude pricing. Calendar details via Investing.com Economic Calendar.
    • Federal Reserve speakers: Any commentary on geopolitical risks affecting the inflation or growth outlook may influence Treasury and equity markets. Fed schedule available at Federal Reserve.
    • OPEC+ monitoring: Any response from OPEC+ regarding production levels in light of Middle East tensions is worth watching, per OPEC Official Communications.

    Risk Disclaimer: Trading CFDs involves substantial risk and may result in the loss of your invested capital. CFDs are complex instruments and come with a high risk of losing money rapidly due to leverage. You should consider whether you understand how CFDs work and whether you can afford to take the high risk of losing your money. Past performance is not indicative of future results. This content is for informational and educational purposes only and does not constitute investment advice.

  • Earnings Reports: Analyzing Price Gaps in Tech Stocks

    Earnings Reports: Analyzing Price Gaps in Tech Stocks

    Four times a year, the financial markets participate in a ritual of high drama known as earnings season. For weeks, the atmosphere is thick with speculation, analyst revisions, and whispered rumors. Then, the numbers are released, usually after the closing bell rings, and the market delivers its verdict.

    When it comes to the technology sector, this verdict is rarely delivered with a gentle nudge. It is delivered with a sledgehammer. A tech company can close at $100 on Tuesday afternoon and open at $120 on Wednesday morning. Or, just as easily, it can open at $80. This empty space on the price chart, where no trading occurred, but the valuation changed dramatically, is known as a “gap.”

    For some market participants, these gaps may appear unpredictable. They can also reflect periods of significant supply and demand imbalance, which may be of interest when analysing market behaviour. The concept of “trading the gap” is about understanding the market dynamics behind these movements and how prices behave when trading resumes.

    Understanding the Mechanics of a Gap

    A price gap is simply a difference between the closing price of one day and the opening price of the next. In the context of earnings reports, these gaps may occur following the release of new information, which can lead market participants to re-evaluate the asset’s value.​

    In the tech sector, this repricing can be more pronounced because valuations are often influenced by expectations of future growth. When a company like Nvidia or Alphabet reports its quarterly results, investors are not just looking at the profit it made over the last ninety days. They are scrutinizing the “Forward Guidance,” the management’s projection of future revenues, capital expenditures, and AI monetization milestones.​​

    If the guidance is significantly better than expected, increased buying interest before the market opens may contribute to a ‘gap up.’ If guidance falls short of expectations, selling pressure may contribute to a ‘gap down.’”

    The Four Types of Earnings Gaps

    Not all gaps are created equal. The context of the chart before the earnings report is just as important as the numbers themselves.

    1. The Breakaway Gap (The Catalyst)
    This occurs when a stock has been moving sideways in a long consolidation phase, boring investors for months.  An earnings report that exceeds expectations can lead to a gap above this range. In some cases, this type of movement has been associated with the early stages of a developing trend, as market participants reassess the company’s outlook.”.​

    2. The Runaway Gap (The Accelerator)
    This is observed  when a stock is already in a strong uptrend, and the earnings report confirms the bullish thesis. The stock may gap up again, accelerating the trend. This type of movement can be associated with sustained buying interest, although it may also occur in later stages of a trend.

    3. The Exhaustion Gap (The Final Gasp)
    This pattern may occur after an extended upward movement. Following an earnings release, the stock may gap higher but subsequently decline during the same session, forming a long upper shadow on the chart. In some cases, this type of price action has been associated with shifts in market sentiment following the initial reaction.​

    4. The Gap Down (The Reality Check)
    When a technology company reports results below expectations, the stock may open lower, forming a gap down.  The severity of the continued selloff often depends on the broader market context and whether institutions view the miss as a temporary hiccup or a structural flaw in the business model.​

    Analytical Frameworks for the Modern Tech Market

    As we analyze tech earnings in 2026, the focus has shifted. It is no longer sufficient for a company to simply announce high revenue growth. The market has become discerning, demanding clarity on capital discipline and cash flow quality.​

    When a gap occurs, analysts typically dissect three key areas to determine if the new price level is sustainable:

    • The AI Monetization Question
      Tech companies are spending billions on infrastructure. The market wants to see how those investments are translating into actual revenue streams. A gap up driven purely by promises of future AI capabilities is often viewed with more skepticism than a gap up driven by measurable productivity gains and new software subscriptions.​
    • Margin Resilience
      If a company beats revenue estimates but reports shrinking profit margins due to  rising costs, the sustainability of a gap up may be affected. In some cases, companies that demonstrate cost management and pricing power may be viewed more favourably​
    • The “Beat and Raise” Dynamic
      The holy grail of an earnings report is the “beat and raise.” This means the company beat the current quarter’s expectations and raised its guidance for the next quarter. Gaps associated with a genuine beat and raise in some cases, showed different price behaviour compared to those driven primarily by past performance.

    Understanding the Gap: Observation over Anticipation

    A common pitfall for many participants is attempting to predict the direction of the gap before the earnings are released. This approach often resembles a coin toss. Even if an investor correctly guesses that a company will report strong numbers, the stock might still gap down if the market had already “priced in” an even stronger result. The market reaction is often counterintuitive to the headline numbers.

    One way to analyse these movements involves waiting for the gap to occur and observing the price action that follows.

    • The “Gap Fill” Concept
      There is a common trading adage that “all gaps must be filled.” This means that if a stock gaps up from $100 to $110, it will eventually trade back down to $100 to “fill” that empty space on the chart. While this is not a universal law, it happens frequently enough to warrant attention.

    Some market participants observe the first thirty minutes of trading (the opening range). If a stock gaps up but cannot maintain its momentum and begins to fall below its opening price, this may be interpreted as weaker follow-through in the initial move. Conversely, if a stock gaps down but immediately finds buyers and pushes higher, it may suggest the selloff was an overreaction.

    The Role of Context

    No gap exists in a vacuum. A positive earnings report from a single software company might fail to generate a sustained rally if the broader Nasdaq 100 index is experiencing a heavy selloff due to macroeconomic concerns like inflation data.

    Therefore, understanding the macro environment can be an important factor. The tech sector’s performance is often closely tied to interest rate expectations and global demand dynamics. Evaluating a gap requires synthesizing the company’s specific fundamental data with the broader market’s risk appetite at that specific moment.​

    Clearing the Noise

    Price gaps in tech stocks during earnings season often reflect underlying market psychology.  It requires looking past the sensational headlines and focusing on the underlying mechanics of supply, demand, and forward guidance.

    Market relationships are dynamic and may change over time. The patterns that defined earnings reactions in previous years may not hold as the technology sector evolves and the focus shifts from hardware buildouts to software monetization. Past performance and historical gap fills do not guarantee future results.

    In some cases, market participants focus on how price action develops following the initial reaction, including factors such as volume and overall market behaviour. Gaps can be viewed as a reflection of shifting market sentiment rather than a definitive signal.


    Final Reminder. Risk Never Sleeps: Trading involves risk and may not be suitable for all investors. This content is for educational and  informational purposes only and does not constitute investment advice or a recommendation.

  • Oil Slides Below $95 on Reports of US-Iran Ceasefire Proposal

    Oil Slides Below $95 on Reports of US-Iran Ceasefire Proposal

    Global crude oil prices fell below $95 per barrel during Monday’s session after MarketWatch reported that President Trump proposed a one-month ceasefire with Iran, prompting markets to reprice near-term geopolitical risk premium across energy markets.

    Context

    The reported ceasefire proposal, as covered by MarketWatch, has introduced the possibility of reduced supply disruption risk in the Strait of Hormuz — a critical chokepoint through which an estimated 20% of global oil trade passes, according to the U.S. Energy Information Administration (EIA). Traders appear to be unwinding a portion of the geopolitical risk premium that had been built into crude prices in preceding sessions.

    According to analysts cited by Reuters, markets have been sensitive to any signals that could reduce the probability of a direct confrontation affecting Iranian oil exports, which the EIA estimates at approximately 3.2 million barrels per day. A formal de-escalation, if confirmed, could alter the near-term supply outlook materially.

    However, analysts caution that ceasefire proposals in geopolitically complex situations may not translate into durable agreements. Uncertainty over diplomatic follow-through remains elevated, and any breakdown in talks could see risk premium re-enter prices. Market relationships between geopolitical developments and commodity prices are dynamic and may change over time.


    Key Data

    • WTI Crude (CL=F): Trading below $95.00/bbl, according to CME Group
    • Brent Crude (BZ=F): Tracking lower in parallel, per ICE Futures
    • The intraday move represents a notable pullback from recent session highs, as reported by MarketWatch
    • $95/bbl has historically acted as a psychologically significant level for WTI, per Bloomberg Markets
    • $90/bbl represents a further area that market participants have previously referenced as a key observational threshold, according to TradingView

    Market Snapshot

    AssetLevelChangeSource
    WTI Crude (CL=F)~$94.80/bbl▼ ~1.5–2.0% est.CME Group
    Brent Crude (BZ=F)~$98.20/bbl▼ ~1.3–1.8% est.ICE
    USO (Oil ETF)Tracking lower▼ IntradayYahoo Finance
    XLE (Energy Sector ETF)Declining▼ IntradayYahoo Finance
    USD Index (DXY)~104.20SteadyReuters
    S&P 500 FuturesModestly firmer▲ SlightBloomberg
    U.S. 10-Yr Yield~4.42%FlatU.S. Treasury

    Note: Price levels are indicative and subject to change. Percentage moves are estimates pending session close confirmation.


    Events Ahead

    Traders and analysts may be watching the following upcoming catalysts for further direction in energy markets:

    • EIA Weekly Crude Inventory Report — Weekly U.S. stockpile data could influence near-term supply sentiment; schedule available via EIA
    • OPEC+ Production Policy Updates — Any revision to output targets from the group could affect the supply-demand balance; monitor via OPEC Official Site
    • US-Iran Diplomatic Developments — Confirmation or denial of ceasefire terms may prompt further repricing of geopolitical risk premium; tracked via Reuters Geopolitics
    • US CPI Data — Inflation figures could influence Federal Reserve rate expectations, which may have secondary effects on USD-denominated commodity pricing; calendar via BLS
    • Fed Speaker Appearances — Any commentary on the economic outlook could affect broader risk sentiment; schedule via Federal Reserve

    Risk Disclaimer: Trading CFDs involves substantial risk and may result in the loss of your invested capital. CFDs are complex instruments and come with a high risk of losing money rapidly due to leverage. You should consider whether you understand how CFDs work and whether you can afford to take the high risk of losing your money. Past performance is not indicative of future results. This content is for informational and educational purposes only and does not constitute investment advice.

  • Nasdaq 100 vs. S&P 500: A Comparison for Tech-Focused Traders

    Nasdaq 100 vs. S&P 500: A Comparison for Tech-Focused Traders

    When it comes to trading the titans of the American economy, two heavyweight indices dominate the conversation. In one corner, you have the S&P 500, the venerable benchmark of corporate America, tracking the 500 largest companies across all sectors. In the other corner stands the Nasdaq 100, a leaner, more focused index tracking 100 of the largest non-financial companies, heavily skewed towards the technology sector.

    For the modern trader, choosing between these two instruments is not merely a matter of picking a ticker symbol. It is a decision about concentration, volatility, and exposure to the specific mechanics of the technology sector. It is often suggested that the S&P 500 provides broader diversification, while the Nasdaq 100 offers more concentrated exposure to the technology sector. However, recent market developments suggest, that traditional narrative requires a closer examination.

    This analysis will break down the structural differences, performance metrics, and behavioral characteristics of these two indices, exploring how they function in a market dominated by artificial intelligence and digital infrastructure.

    The Illusion of Diversification

    Historically, the primary argument for trading the S&P 500 was diversification. By holding 500 companies across sectors like financials, energy, industrials, and healthcare, exposure to a single industry may be reduced. If tech crashed, perhaps energy would rally, smoothing out the overall curve.

    The Nasdaq 100, by its very design, lacks this broad diversification. It explicitly excludes financial companies and is heavily weighted toward technology. The Nasdaq got its reputation as a tech-focused exchange early on, notably listing Microsoft in 1986, and it has maintained that DNA ever since. Today, the top holdings of the Nasdaq 100 are a familiar roster of tech giants, including Nvidia, Apple, Microsoft, Amazon, and Alphabet.

    However, the S&P 500 has undergone a quiet transformation. Because the S&P 500 is market capitalization weighted, the massive growth of the mega-cap tech companies has dramatically altered its composition. The same “Magnificent Seven” that dominate the Nasdaq 100 now also represent a significant portion  t of the S&P 500.

    This concentration suggests the performance of the S&P 500 is increasingly tethered to the performance of the technology sector. Some market observers have noted that as the tech giants grew, the correlation between the two indices increased significantly. By early 2026, analysis indicated that the rolling correlation between the two indices had reached extremely high levels, with one commentary suggesting they sometimes appeared to move in “perfect lockstep”.

    These developments suggest that the diversification characteristics of the S&P 500 may have evolved over time. While it remains a broad market index, its performance may be more influenced by large technology companies than in the past

    The Volatility Profile

    While the correlation between the two indices is high, their behavior during periods of market stress reveals key differences. The Nasdaq 100 has historically exhibited higher volatility compared to the S&P 500.

    Volatility is the trader’s raw material, and the Nasdaq 100 provides it in abundance. Over historical periods, the annualized volatility of the Nasdaq 100 is generally higher than that of the S&P 500. This means the price swings up and down are wider.

    This higher volatility can have varying effects. During certain market conditions, including periods associated with technological growth or accommodative monetary policy, the Nasdaq 100 has at times outperformed the S&P 500. The index acts like a magnifying glass for tech optimism. Furthermore, the companies within the Nasdaq 100 typically reinvest a larger portion of their revenue back into Research and Development compared to the broader S&P 500, which may support future growth initiatives.

    Conversely, during market corrections, the Nasdaq 100 often experiences deeper drawdowns. For example, during significant historical corrections, the percentage fall in the Nasdaq 100 was generally steeper than the corresponding fall in the S&P 500. Due to its more limited exposure to  defensive sectors like utilities or consumer staples, a tech selloff hits the Nasdaq 100 directly and forcefully.​

    The Mechanics of the Trade

    For a trader focusing specifically on the technology sector, the choice between the two indices comes down to the desired level of exposure.

    Trading the Nasdaq 100 may provide more concentrated exposure to themes such as technology, interest rates, and innovation. It has historically shown sensitivity to changes in monetary policy. Because many tech companies rely on future earnings to justify their valuations, higher interest rates discount the value of those future earnings, often causing the index to reprice sharply.In scenarios where market participants expect changes such as interest rate adjustments or increased investment in AI-related sectors, the Nasdaq 100 may reflect these themes more directly due to its composition.

    Trading the S&P 500, while still heavily influenced by tech, offers a slightly dampened experience. The presence of the “other 400” companies provides a buffer. If a regulatory crackdown specifically targets tech giants, the S&P 500 may weather the storm slightly better due to its exposure to financials and healthcare. It is a blunter instrument for tech trading, but one with a historically lower risk profile in terms of severe drawdowns.

    Furthermore, it is important to consider the macroeconomic forces that drive both indices simultaneously. During periods of broader economic crisis or recovery, factors such as inflation data and central bank policy may influence both indices, sometimes resulting in similar directional movements. A rising tide generally lifts both ships, and a draining pool lowers them both, even if the Nasdaq bobs up and down more violently in the process.​

    Conclusion: Comparing Index Characteristics

    The debate between the Nasdaq 100 and the S&P 500 is not about which index is inherently “better”  but about understanding the different characteristics of each instrument

    The Nasdaq 100 offers concentrated exposure to the companies building the digital infrastructure of the future. It has historically exhibited higher sensitivity to market movements, with periods of both strong performance and significant drawdowns.

    The S&P 500 offers a broader representation of the US economy, although it remains influenced by large technology companies. It has historically shown different volatility characteristics compared to the Nasdaq 100.

    Market relationships are dynamic and may change over time, and past correlations do not guarantee future performance. As the AI cycle matures and the global economic landscape shifts, the relative performance of these two indices will continue to evolve. Market participants may compare different indices based on their characteristics and prevailing market conditions when forming their own views.


    Final Reminder. Risk Never Sleeps: Trading involves risk and may not be suitable for all investors. This content is for informational purposes only and does not constitute investment advice or a recommendation.