Category: Commodity Markets

  • Cuba’s Diesel Collapse Shows What a Real Supply Shock Looks Like

    Cuba’s Diesel Collapse Shows What a Real Supply Shock Looks Like

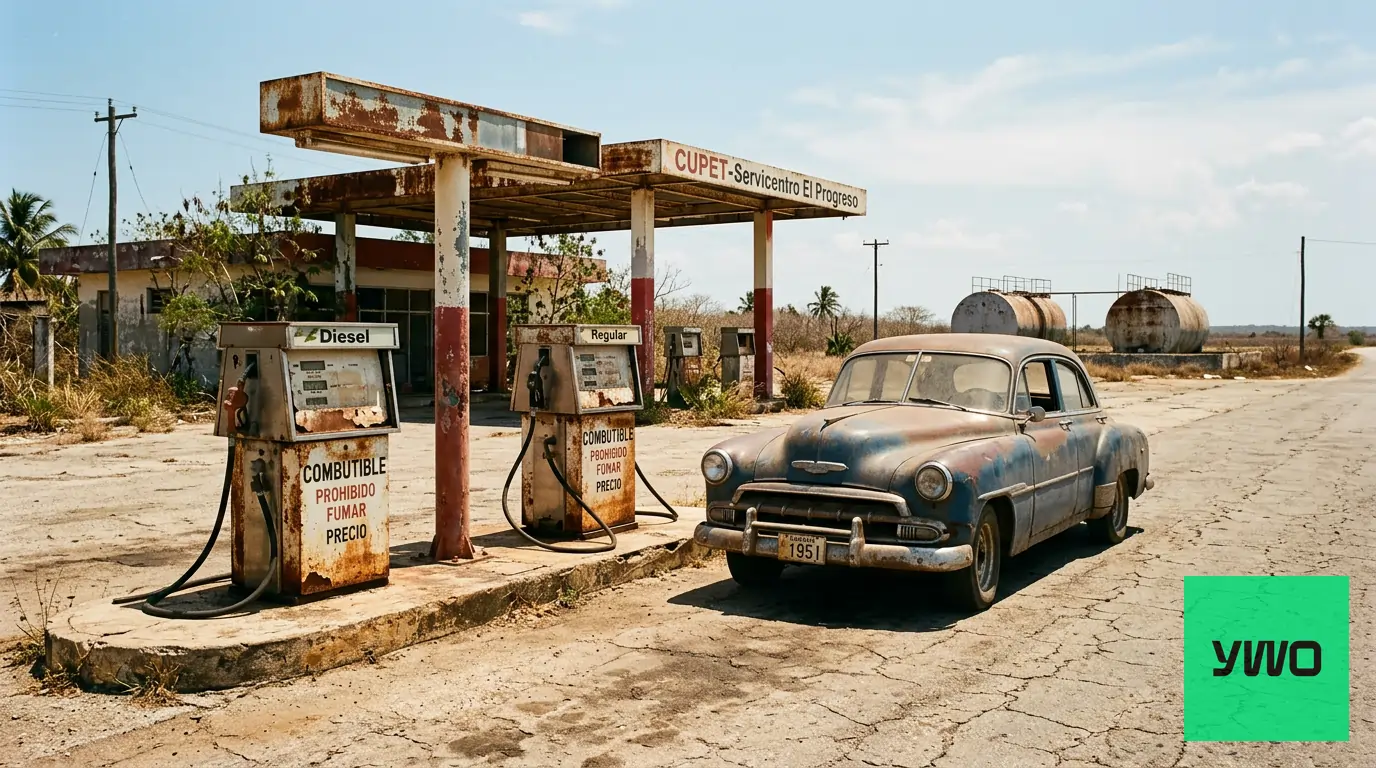
    Cuba has run out of diesel and fuel oil, and the protests breaking out across Havana are not a political story — they are a case study in what happens when hydrocarbon import dependency meets sustained supply disruption, according to Investing.com News. Reports suggest that the island has no buffer, no alternatives, and no near-term relief visible.

    Power cuts are deepening. The situation highlights how severe supply disruptions can affect import-dependent economies 

    The proximate cause, per the same report, is the tightening of the US oil blockade. Cuba’s fuel supply chain runs almost entirely on imported hydrocarbons — primarily crude and refined products — and with that pipeline now severed at the source, the economy has effectively stalled.

    Diesel is the working fluid of any island economy: it runs generators when the grid goes dark, moves food from ports to markets, and keeps hospitals on backup power. When the diesel is gone, those are not inconveniences. They are cascading, compounding failures.


    Why This Matters Beyond One Island

    Cuba’s GDP is not a market-moving variable. But the structural dynamic on display here — a sanctions-enforced supply cutoff driving acute domestic energy collapse — has precedents that commodity traders do monitor, particularly in the context of how quickly a physical shortage can spiral once inventories drop to zero.

    Reports suggest Cuba currently has limited access to alternative supply channels or strategic reserves. 

    For crude oil and distillate markets more broadly, Cuba is not a material demand centre. The supply impact on global Brent or WTI pricing from Havana’s crisis will likely be negligible. What the situation does illustrate, however, is the fragility baked into any economy that runs a single-corridor import model for refined products. Fuel oil and diesel are fungible globally, but only if you can access the market — and access requires either hard currency, political neutrality, or both. Cuba however, faces significant constraints in both. 

    The mechanism worth watching is indirect. Venezuela, Cuba’s primary hydrocarbon benefactor in recent years, has itself been operating under layered US sanctions. If Washington’s posture toward Caribbean energy flows is hardening simultaneously — and the Cuba reporting suggests it is — then the question for distillate traders is whether any overspill demand materialises in regional spot markets, or whether supply disruptions result in broader economic shutdowns 


    The Diesel Market Sits in a Different Place Than Crude

    Diesel and fuel oil are not crude oil. That distinction matters for how traders should think about supply disruption risk. Refining capacity, crack spreads, and regional logistics create a second layer of vulnerability that pure crude-price analysis misses.

    The shortages appear linked to both supply and logistics limitations — the country would need both the crude and the refining capacity (or access to finished products) to restore normal function. Sanctions significantly restrict   both pathways simultaneously.

    For names exposed to Caribbean or Latin American refined-product distribution, the Cuba situation is more of a political-risk flag than a near-term earnings catalyst. The volumes are simply not large enough to move the needle on major integrated majors.

    The risk, if it spreads, is reputational and regulatory — any third-country supplier seen breaking the US blockade faces secondary sanctions exposure that has historically been enough to deter most commercial counterparties.

    That calculus is not new. What has changed, per the Investing.com News report, is that the blockade appears to have tightened to the point where Cuba can no longer source even emergency supplies. Reaching zero inventory — not just running low, but exhausting stocks entirely — is a different threshold. It suggests whatever informal supply chains were operating have been closed off.


    The Bear Case for a Quiet Market Reaction

    The most likely market outcome here is very little price movement at all. Cuba’s total energy consumption is marginal in global terms. The protests in Havana, while a humanitarian concern  and a sign of genuine social stress, may have limited direct impact on  Brent pricing or distillate crack spreads in a measurable way. Traders pricing geopolitical risk into crude tend to focus on production chokepoints — the Strait of Hormuz, OPEC+ quotas, Libyan export terminals — not consumption-side collapses in small island economies.

    The counterargument is that this episode may inform how markets eventually reprice Latin American energy security risk more broadly, particularly if US sanctions policy continues to evolve. Economies with similar import-dependency structures — and there are several in the region — could become more visible on commodity desks if the Cuba situation triggers a broader policy review in Washington or generates humanitarian pressure that forces diplomatic movement.

    For now, the crude and distillate markets appear to be taking the Cuba story as a geopolitical footnote rather than a supply-demand catalyst. Whether that changes depends less on oil market fundamentals and more on whether the diplomatic and sanctions environment shifts, according to Reuters.

    The EIA’s weekly petroleum supply data remains the primary reference point for distillate inventory trends across markets, available at EIA.


    Risk Disclaimer: Trading CFDs involves substantial risk and may result in the loss of your invested capital. CFDs are complex instruments and come with a high risk of losing money rapidly due to leverage. You should consider whether you understand how CFDs work and whether you can afford to take the high risk of losing your money. Past performance is not indicative of future results. This content is for informational and educational purposes only and does not constitute investment advice.


  • IEA: 12.8 Million Barrels Lost Since February, and the Market Is Still Tightening

    IEA: 12.8 Million Barrels Lost Since February, and the Market Is Still Tightening

    The oil market is not correcting — it is compounding. The IEA’s May report, released Wednesday, shows global supply fell another 1.8 million barrels per day in April, bringing total losses to 12.8 mb/d since the U.S.-Israeli war with Iran began on February 28. Global inventories are now depleting at what the agency called a “record pace,” and the IEA’s message was unambiguous: the turmoil is far from over.

    Brent futures traded near $107 per barrel on Wednesday, with WTI just above $101. More than ten weeks into the Strait of Hormuz disruption, both benchmarks remain elevated as the market grapples with the largest supply shock in the history of the oil market — a characterisation Morgan Stanley commodities strategist Martijn Rats put directly to clients in a Monday note, calling it “neither an exaggeration nor controversial.”


    The Supply Hole Is Bigger Than OPEC+ Can Fill

    The cartel’s response has been real but insufficient. OPEC+ agreed on May 3 to lift June output by 188,000 barrels per day — fractionally below May’s hike of 206,000 bpd, and well short of the monthly losses the Hormuz disruption is generating, according to CNBC’s Joseph Wilkins. Complicating the arithmetic: the UAE officially departed OPEC on May 1, so Sunday’s output figure excludes its share entirely. The seven remaining members — Saudi Arabia, Russia, Iraq, Kuwait, Kazakhstan, Algeria, and Oman — are producing more, but the math doesn’t close.

    Morgan Stanley estimates the market could lose another one billion barrels over the course of 2026, driven by the time required to restart oilfields, repair refineries, and reposition the tanker fleet. That’s a structural drag, not a sentiment one.


    Demand Is Breaking, But Not Fast Enough to Rebalance

    The IEA isn’t ignoring destruction on the demand side. The agency forecasts a contraction of 420 thousand barrels per day year-on-year by end-2026, taking global demand to 104 million barrels per day. Petrochemicals and aviation are absorbing the sharpest impact first — both sectors are heavily exposed to spot energy prices with limited near-term substitution capacity.

    The problem for bulls is that the IEA still expects the market to end 2026 in a deficit even after accounting for that demand contraction. Supply losses aren’t just running ahead of OPEC+ increases — they’re outpacing demand destruction. That combination keeps the structural tilt upward for crude through the peak summer demand window.


    What This Means Beyond the Crude Barrel

    XLE, the US energy sector ETF, has historically tracked Brent directionally during sustained supply-driven rallies. Whether that relationship holds through summer may depend on refinery margins — elevated crude input costs tend to squeeze throughput economics even as upstream producers benefit from higher realisations.

    Airlines and industrial names with large fuel cost bases are the clearest transmission channel on the other side. Aviation is already flagged by the IEA as among the most affected sectors; any further leg higher in WTI above $101 may accelerate capacity cuts and fare increases that compound through consumer discretionary spending.


    The Scenario That Ends the Rally

    The realistic counter to the IEA’s warning is a faster-than-expected ceasefire or humanitarian corridor arrangement around the Strait of Hormuz, which could trigger a rapid unwind of the geopolitical risk premium embedded in the $107 Brent print. Commercial and government strategic reserves are already being released to offset losses — if that pace accelerates materially, or if Hormuz transit partially resumes, the inventory depletion rate could ease faster than the May report assumes. The IEA’s own demand contraction forecast — 420 thousand bpd by year-end — also sets an active ceiling on how high prices can go before destroying enough demand to rebalance the market at a lower level.

    For now, the agency’s deficit projection for year-end suggests that scenario hasn’t arrived yet.


    Source: CNBC — Joseph Wilkins, published 2026-05-13T12:12:32+0000


    Risk Disclaimer: Trading CFDs involves substantial risk and may result in the loss of your invested capital. CFDs are complex instruments and come with a high risk of losing money rapidly due to leverage. You should consider whether you understand how CFDs work and whether you can afford to take the high risk of losing your money. Past performance is not indicative of future results. This content is for informational and educational purposes only and does not constitute investment advice.

  • WTI Breaks $100 as Trump Calls Iran Ceasefire “On Life Support”

    WTI Breaks $100 as Trump Calls Iran Ceasefire “On Life Support”

    The $100 handle on WTI is back, and this time it’s not about supply cycles or OPEC quotas — it’s about a ceasefire that Trump himself described as having “approximately a 1% chance of living.” That’s not a diplomatic euphemism. It is really reducing the probability of a near-term diplomatic resolution 

    WTI futures for June rose 3.3% to $101.37 per barrel as of 07:57 ET on Tuesday. Brent crude for July gained 3.2% to $107.58 a barrel in the same window, according to CNBC’s Justina Lee. Both benchmarks are now up more than 40% since the US and Israeli-led war against Iran began on February 28.


    Trump Rejects Iran Counterproposal as Oil Risk Premium Expands 

    The catalyst was blunt. Trump told reporters that Tehran’s counter proposal to end the conflict was “garbage,” and characterised the ceasefire’s condition in terms no diplomat would choose: “I would say the ceasefire is on massive life support, where the doctor walks in and says, ‘Sir, your loved one has approximately a 1% chance of living.’” That quote, reported by CNBC, stripped whatever peace premium remained in oil positioning. Markets had apparently been holding some probability of a deal. They’re not holding much now.

    The Strait of Hormuz sits at the centre of this. A prolonged blockage could place upward pressure on spot prices and materially affect futures curve dynamics and supply-chain pricing . Saudi Aramco CEO Amin Nasser, speaking on the company’s Q1 earnings call Monday, put a hard timeline on the damage: “If the Strait of Hormuz opens today, it will still take months for the market to rebalance, and if its opening is delayed by a few more weeks, then normalization will last into 2027.” That framing from the head of the world’s largest oil company is not a hedge — it’s a warning about structural tightness.

    The satellite image circulated alongside CNBC’s report showed the Salalah oil storage fire in Oman — ignited by an Iranian drone strike on March 11 — still visible as a plume over the Gulf of Oman’s strategic port as late as March 13. That fire, weeks after the strike, is the visual shorthand for how slowly infrastructure damage clears in this conflict.


    The Sectors That Feel This First

    At $100-plus WTI, the pressure on downstream names is immediate. Airline margins, already squeezed by the conflict’s knock-on effects on regional routes, face a fresh headwind from jet fuel costs closely correlated with Brent. Trucking and logistics names with unhedged fuel exposure are in the same position. Conversely, energy producers have historically attracted investor attention during periods of elevated crude pricing, though equity performance may vary depending on broader market conditions. 

    Citi flagged the directional risk plainly: “Oil prices have been volatile and can rise further if US-Iran dealmaking remains thorny,” the bank wrote in a note cited by CNBC.


    The One Path That Could Change This

    Henry Wilkinson, chief intelligence officer at geopolitical and security intelligence firm Dragonfly, told CNBC’s Squawk Box Asia on Tuesday that re-escalation remains possible but flagged one specific channel worth watching: Trump may ask Chinese President Xi Jinping to press Iran to accept US terms later this week during China-US talks. If Beijing applies that pressure and Tehran signals flexibility, a rapid reversal in oil pricing could follow — the same speed in reverse. A genuine ceasefire or Hormuz reopening announcement could prompt rapid repositioning in crude markets and increased short-term volatility . The 40%-plus rally since February means crowded longs, and crowded longs unwind quickly when the headline changes.

    That’s the bear case on the trade: the geopolitical bid in oil is entirely binary. Either the war drags and Nasser’s 2027 normalisation call proves accurate, or a single diplomatic breakthrough may compress the risk premium within hours. There’s not much in between.


    Risk Disclaimer: Trading CFDs involves substantial risk and may result in the loss of your invested capital. CFDs are complex instruments and come with a high risk of losing money rapidly due to leverage. You should consider whether you understand how CFDs work and whether you can afford to take the high risk of losing your money. Past performance is not indicative of future results. This content is for informational and educational purposes only and does not constitute investment advice.

  • Brent Crude Surges to Four-Year High Amid US-Iran Tension Reports

    Brent Crude Surges to Four-Year High Amid US-Iran Tension Reports

    Brent crude climbed to its highest level since early 2022 on Wednesday before trimming gains, as reports of potential US military action against Iran stoked concern over Middle East supply disruptions. The move rattled global markets broadly, with European equities declining sharply in response to the oil price spike, according to CNBC.


    Context

    Reports circulating during the session raised the possibility of US military action targeting Iran, with market participants  reassessing the risk of disruption to crude flows from one of the world’s major oil-producing regions. Iran remains a significant producer and plays a key role in Strait of Hormuz transit volumes, through which a substantial share of global seaborne oil supply passes.

    According to CNBC, the oil price move has become a central concern for investors navigating an already complex environment, with major central bank policy decisions also approaching. Analysts note that geopolitical risk premiums in energy markets may prove volatile and difficult to sustain if underlying supply data does not deteriorate materially. Market relationships are dynamic and may change over time, and past correlations do not guarantee future performance.

    Both bull and bear cases remain active. Bulls point to the possibility of sustained supply disruption if tensions escalate further. Bears argue that OPEC+ spare capacity and demand uncertainty could limit the extent to which prices remain elevated once geopolitical headlines fade.


    Key Data

    • Brent Crude (BZ=F): Reached multi-year highs last seen in early 2022 before paring gains intraday, according to CNBC
    • WTI Crude (CL=F): Moved broadly in line with Brent during the session, per Reuters
    • Prior to the move, both benchmarks had been trading within a more compressed range amid mixed demand signals from China and US inventory data from the EIA
    • The intraday retracement from session highs may reflect traders reassessing the immediacy of supply risk; this is an observational note and does not constitute a directional forecast

    Market Snapshot

    AssetMove / LevelChangeSource
    Brent Crude (BZ=F)4-year highs (pared)Sharply higher intradayCNBC
    WTI Crude (CL=F)Broadly higherTracking BrentReuters
    European EquitiesDeclined sharplyNegativeCNBC
    USD (Broad)MixedUncertainReuters
    Global Bond YieldsUnder reviewVolatileBloomberg

    Market relationships are dynamic and may change over time. The cross-asset moves noted above reflect intraday conditions and may not persist.


    Events Ahead

    The following upcoming events may influence crude oil and broader market direction. They are presented as items to monitor, not as predictors of market outcomes:

    • Federal Reserve policy decision — Markets are watching for any guidance on the rate path that could affect global demand expectations; see FOMC Calendar
    • US–Iran diplomatic developments — Any de-escalation or further escalation in reported tensions may affect geopolitical risk premiums in energy markets
    • EIA Weekly Petroleum Supply Report — Upcoming inventory data could provide additional context on near-term supply-demand dynamics; EIA
    • Broader macro calendar — Additional central bank communications and economic data releases tracked via Investing.com Economic Calendar

    Risk Disclaimer: Trading CFDs involves substantial risk and may result in the loss of your invested capital. CFDs are complex instruments and come with a high risk of losing money rapidly due to leverage. You should consider whether you understand how CFDs work and whether you can afford to take the high risk of losing your money. Past performance is not indicative of future results. This content is for informational and educational purposes only and does not constitute investment advice.

  • Oil Prices Rise Over 1%, Brent Tops $106 as Iran Conflict Weighs on Energy Markets

    Oil Prices Rise Over 1%, Brent Tops $106 as Iran Conflict Weighs on Energy Markets

    Oil prices advanced on Friday, with Brent crude surpassing $106 per barrel and WTI crude climbing over 1%, following comments from  President Donald Trump that no immediate intent to resolve the ongoing conflict with Iran, according to Investing.com. The moves put both benchmarks on course for a meaningful weekly gain, reflecting heightened geopolitical uncertainty across global energy markets.


    Context

    The latest leg higher in crude prices follows remarks from President Trump indicating that the United States is not in a hurry to bring the Iran conflict to a close, according to Investing.com. Iran remains one of the world’s significant oil producers, and any sustained military escalation in the region has historically introduced meaningful supply-risk premiums into energy markets. Market relationships are dynamic and may change over time, and past correlations between geopolitical events and oil price movements do not guarantee future performance.

    Traders and analysts are monitoring the situation closely, given Iran’s position within the Strait of Hormuz corridor — a critical passage for a substantial portion of global crude flows.

    Disruption to that route, or the prospect thereof, has historically contributed to elevated price volatility in energy futures markets. Markets appear to be pricing in a sustained uncertainty premium for now, though the extent and duration of any price support will depend on how the geopolitical situation evolves, according to Reuters.

    On the supply side, broader OPEC+ production dynamics and the trajectory of U.S. shale output remain factors that analysts suggest could temper or amplify price moves over the near term. Separately, EIA weekly petroleum data continues to provide insight into U.S. inventory levels, which markets may weigh alongside geopolitical developments.


    Key Data

    The following price levels and movements were observed during Friday’s session, as reported by Investing.com:

    • Brent Crude (BZ=F): Traded above $106 per barrel, representing an intraday advance of more than 1%
    • WTI Crude (CL=F): Rose in tandem, posting gains of over 1% on the session
    • Both benchmarks are tracking for a weekly gain, reflecting sustained buying interest throughout the week
    • $106 represents a technically notable level for Brent, which has historically acted as a zone of interest for market participants; it is an observational reference, not a directional signal

    The bull case for crude rests on the geopolitical risk premium potentially widening if the Iran conflict escalates further or extends in duration. The bear case centres on the possibility of diplomatic resolution, demand-side softening in major economies, or a supply-side response from non-OPEC producers that could weigh on prices over time. Both scenarios carry significant uncertainty.


    Market Snapshot

    AssetLevelChangeSource
    Brent Crude (BZ=F)~$106.00++1%+Investing.com
    WTI Crude (CL=F)~$103–104 range+1%+Investing.com
    USD Index (DXY)In focusVariableReuters
    Gold (XAU/USD)ElevatedPositiveReuters
    U.S. 10-Yr YieldUnder reviewVariableReuters
    S&P 500 FuturesIn focusVariableMarketWatch
    EUR/USDIn focusVariableReuters

    Note: Levels reflect intraday session data. Market relationships across asset classes are dynamic and may change. Past correlations do not guarantee future performance.

    Geopolitical risk events of this nature have historically supported safe-haven assets such as gold and U.S. Treasuries, while equity markets and risk-sensitive currencies may face headwinds — though outcomes vary and depend on a range of macroeconomic and political factors, according to Bloomberg.


    Events Ahead

    The following upcoming events and data releases may influence oil and broader commodity markets. Traders are encouraged to monitor the Investing.com Economic Calendar for scheduling and consensus estimates:

    • Iran conflict developments: Any diplomatic signals or military escalation could materially affect the geopolitical risk premium priced into crude
    • OPEC+ communications: Any scheduled or unscheduled statements from member nations regarding output targets may be relevant to supply-side pricing
    • U.S. EIA Weekly Petroleum Status Report: EIA data on U.S. crude inventories and production levels may provide additional context for WTI pricing
    • Federal Reserve commentary: Any remarks from Fed officials regarding inflation — to which energy prices contribute — could influence broader market sentiment; see the Federal Reserve events calendar
    • Global PMI and demand data: Manufacturing activity figures from major economies may affect medium-term crude demand expectations, according to Reuters
    • USD trajectory: Movements in the U.S. dollar index may interact with commodity pricing; market relationships are dynamic and may change over time

    Risk Disclaimer: Trading CFDs involves substantial risk and may result in the loss of your invested capital. CFDs are complex instruments and come with a high risk of losing money rapidly due to leverage. You should consider whether you understand how CFDs work and whether you can afford to take the high risk of losing your money. Past performance is not indicative of future results. This content is for informational and educational purposes only and does not constitute investment advice.
  • Dutch Benchmark Gas Prices Fall on Iran Peace Talk Signals

    Dutch Benchmark Gas Prices Fall on Iran Peace Talk Signals

    Dutch Title Transfer Facility (TTF) natural gas futures declined in European trading on Monday after U.S. President Donald Trump signalled renewed diplomatic engagement with Iran, introducing the possibility that Middle East energy supply conditions could ease, according to Investing.com. The move coincided with  a broader softening in European energy prices, with oil futures also trading lower in early session activity.


    Context

    Iran holds among  the world’s largest proven natural gas and crude oil reserves, and any diplomatic developments involving Tehran tend to attract close attention from energy market participants. The prospect of renewed negotiations between Washington and Tehran has prompted some traders and analysts to reassess the near-term risk premium embedded in European gas prices, according to Investing.com.

    European gas markets have remained sensitive to geopolitical developments across the Middle East, particularly since the 2022 energy crisis reshaped regional supply chains. While Iran is not a direct supplier to European TTF markets, shifts in global liquefied natural gas (LNG) flows and broader crude oil sentiment may influence European gas pricing dynamics. Market relationships of this kind are dynamic and may change over time; past correlations do not guarantee future performance.

    Bears on European gas point to the possibility that any diplomatic progress between the U.S. and Iran could, over time, contribute to increased Iranian energy exports reaching global markets, potentially adding to overall supply. Bulls, however, may note that negotiations remain at an early stage, that significant uncertainties persist, and that European gas storage levels and seasonal demand factors continue to exert their own independent influence on TTF pricing.

    The broader European energy complex has tracked the move, with lower oil prices feeding through to sentiment across the continent’s energy markets, according to Investing.com.


    Key Data

    • TTF Natural Gas Futures: Declined in Monday’s European session, reflecting reduced geopolitical risk sentiment, per Investing.com.
    • U.S. Natural Gas (NGas): Also observed trading softer amid the broader energy market tone, according to Investing.com.
    • Oil Futures: Brent and WTI crude were observed trading lower in early European hours, contributing to the negative energy complex sentiment, per Reuters.

    TTF has shown some  sensitivity to geopolitical risk premiums in the Middle East, though the relationship between regional diplomatic developments and European hub pricing is complex and subject to multiple intervening variables. Levels observed in recent sessions may be used  as reference points for market participants, though they carry no predictive implications for future price action.


    Market Snapshot

    AssetLevelChangeSource
    TTF Natural GasDeclinedLowerInvesting.com
    U.S. Natural Gas (NGas)SofterLowerInvesting.com
    Brent Crude OilLowerNegativeReuters
    WTI Crude OilLowerNegativeReuters
    EUR/USDReuters
    European EquitiesMixedReuters

    Note: Precise intraday price levels were not confirmed across all assets at time of publication. Readers are encouraged to consult live market data via their preferred provider.


    Events Ahead

    The following scheduled events and developments may attract market attention in the coming sessions. These are presented as items to monitor, not as predictors of price direction:

    • Iran-U.S. diplomatic developments: Further statements from either government regarding the status of negotiations may influence energy market sentiment, per Investing.com.
    • European gas storage data: Periodic updates on European gas storage refill progress could affect TTF pricing dynamics independent of geopolitical factors. Check the Investing.com Economic Calendar for scheduled releases.
    • EIA Weekly Petroleum Status Report: The U.S. Energy Information Administration’s weekly inventory data may influence broader energy sentiment; available via EIA.
    • FOMC and central bank commentary: Any shifts in the monetary policy outlook from the Federal Reserve or the European Central Bank may affect the broader macro environment in which energy prices trade.
    • Middle East geopolitical news flow: Ongoing developments in the region are associated with  potential volatility for energy markets and may be associated with rapid repricing in either direction.

    Risk Disclaimer: Trading CFDs involves substantial risk and may result in the loss of your invested capital. CFDs are complex instruments and come with a high risk of losing money rapidly due to leverage. You should consider whether you understand how CFDs work and whether you can afford to take the high risk of losing your money. Past performance is not indicative of future results. This content is for informational and educational purposes only and does not constitute investment advice.

  • US Crude Falls as Washington-Tehran Peace Talk Optimism Grows

    US Crude Falls as Washington-Tehran Peace Talk Optimism Grows

    Oil prices declined during early Tuesday trading after signals emerged that the United States and Iran may resume diplomatic negotiations,introducing the possibility of reduced geopolitical risk in a region critical to global energy supply. WTI crude (CL=F) and Brent crude (BZ=F) both traded lower as market participants reassessed the geopolitical risk premium that had been embedded in energy prices, according to CNBC reporting at 08:11 UTC.


    Context

    President Donald Trump signalled renewed willingness to engage Iran in peace talks, fuelling optimism that longstanding tensions — which have periodically disrupted shipping through the Strait of Hormuz — could ease, as reported by CNBC. The Strait of Hormuz remains one of the world’s most strategically sensitive energy chokepoints, with approximately 20% of global oil supply transiting the waterway, according to EIA data.

    Market participants have historically priced a geopolitical risk premium into crude when tensions in the Middle East escalate. Diplomacy that may reduce that risk tends to exert downward pressure on oil prices, though analysts note that market relationships are dynamic and may change over time depending on broader supply and demand fundamentals.

    The prospect of a diplomatic breakthrough also lifted broader risk sentiment globally. Equity index futures edged higher, and safe-haven assets including gold and the US dollar saw modest pressure, suggesting markets may be interpreting the development as a reduction in near-term geopolitical uncertainty.

    However, analysts caution that early-stage diplomatic signals do not guarantee lasting policy shifts. Previous rounds of US-Iran engagement have at times stalled, and any durable impact on Iranian oil supply — including the potential easing of sanctions — would likely require sustained negotiations, according to Reuters.

    The bear case for lower oil prices centres on the possibility that diplomatic progress could eventually unlock additional Iranian crude supply into global markets, weighing on prices over a longer horizon. The bull case holds that talks may falter, geopolitical risk could re-escalate, and that OPEC+ supply management may provide a floor for prices regardless of diplomatic developments.


    Key Data

    • WTI Crude (CL=F): Trading lower in early Tuesday sessions following the diplomatic headlines, according to CNBC
    • Brent Crude (BZ=F): Also under pressure in tandem with WTI, reflecting broadly changes in sentiment across energy markets, per CNBC
    • The Strait of Hormuz accounts for roughly one-fifth of global oil flows, according to the U.S. Energy Information Administration
    • WTI has traded around  $78–$80 range in recent months, though past price behaviour does not indicate future outcomes, per TradingView
    • Brent has historically traded at a $3–$5 premium to WTI, a spread that may fluctuate based on regional supply dynamics, according to Reuters

    Market Snapshot

    AssetApproximate LevelDirectionSource
    WTI Crude (CL=F)Under pressure↓ DecliningCNBC
    Brent Crude (BZ=F)Under pressure↓ DecliningCNBC
    S&P 500 FuturesModest gains↑ Risk-onReuters
    Gold (XAU/USD)Modest pullback↓ Safe-haven easingReuters
    USD Index (DXY)Mixed→ ConsolidatingMarketWatch
    US 10Y Treasury YieldSlightly firmer↑ Risk appetiteReuters
    EUR/USDModest gains↑ Risk-on sentimentFXStreet

    Note: Levels are directional observations based on early session moves. Market relationships are dynamic and may change over time. Past correlations do not guarantee future performance. Readers are encouraged to verify current levels via live data sources.


    Events Ahead

    Traders and analysts may be monitoring the following upcoming catalysts, which could influence crude and broader energy market pricing:

    • US EIA Weekly Petroleum Status Report — Weekly crude and distillate inventory data that may provide near-term directional context for WTI pricing; calendar available at EIA
    • Iran-US diplomatic developments — Any further statements from Washington or Tehran regarding the status of negotiations could affect the geopolitical risk premium embedded in crude; monitor via Reuters Markets
    • Federal Reserve communications — Upcoming Fed speakers may offer guidance on US interest rate trajectory, which has historically influenced dollar strength and commodity pricing; schedule available at Federal Reserve
    • OPEC+ supply policy updates — Any signals from member states regarding production levels may interact with geopolitical developments to influence price direction; via Reuters
    • US economic data releases — Inflation and growth indicators scheduled this week could affect broader risk appetite; full calendar at Investing.com

    Risk Disclaimer: Trading CFDs involves substantial risk and may result in the loss of your invested capital. CFDs are complex instruments and come with a high risk of losing money rapidly due to leverage. You should consider whether you understand how CFDs work and whether you can afford to take the high risk of losing your money. Past performance is not indicative of future results. This content is for informational and educational purposes only and does not constitute investment advice.

  • Oil Falls as IEA Warns of Demand Destruction, Iran Talks Progress

    Oil Falls as IEA Warns of Demand Destruction, Iran Talks Progress

    Oil prices declined on Monday as two converging forces influenced  the market: a fresh warning from the International Energy Agency (IEA) that weaker demand conditions may be emerging , and renewed diplomatic momentum around U.S.-Iran nuclear negotiations. Both WTI crude and Brent crude retreated from recent elevated levels tied to Strait of Hormuz supply disruption concern, according to CNBC.


    Context

    Oil markets had been trading at elevated levels in recent sessions following heightened tensions around the Strait of Hormuz, a critical chokepoint through which a significant share of global seaborne oil flows. That geopolitical risk premium appears to be easing , according to CNBC, as diplomatic activity between Washington and Tehran regains traction.

    U.S. Vice President JD Vance stated on Monday that the next steps in peace efforts depend on Tehran’s response, according to CNBC. Traders appear to be pricing in a reduced probability of sustained supply disruption through the Hormuz corridor, though analysts caution that talks remain at an early stage and outcomes are uncertain.

    Compounding the downward pressure, the IEA issued a warning that demand destruction is spreading across major consuming economies. Elevated energy prices, combined with a broader softening in global manufacturing activity, may be affecting consumption growth, according to Reuters. The IEA’s outlook suggests that supply concerns may be balanced by weaker-than-anticipated demand, a development that markets appear to be weighing carefully.

    Analysts note that the oil market is navigating a delicate balance between geopolitical supply risk on one side and macroeconomic demand headwinds on the other. The price direction may be influenced by  U.S.-Iran diplomatic discussions advance, as well as whether upcoming economic data reinforces or undermines the IEA’s demand destruction thesis. Market relationships between geopolitical risk premiums and crude prices are dynamic and may change over time.


    Key Data

    • WTI Crude (CL1!): Declined during Monday’s session, retreating from levels tied to the Hormuz blockade premium, per CNBC
    • Brent Crude (BZ1!): Followed a similar lower movementalongside WTI, according to CNBC
    • USO (U.S. Oil Fund ETF): Tracked crude lower in equity-hours trading, per Reuters
    • WTI has historically found observational interest around the $80–$85/bbl range in prior geopolitical risk cycles, though past price behavior does not indicate future performance, per TradingView
    • The spread between WTI and Brent — a measure analysts monitor for supply dislocation — may shift if Iranian export volumes return to market, according to Bloomberg

    Market Snapshot

    AssetLevelChangeSource
    WTI Crude (CL1!)DeclinedNegativeCNBC
    Brent Crude (BZ1!)DeclinedNegativeCNBC
    USO ETFLowerNegativeReuters
    USD/CADMixedTBDReuters
    S&P 500 FuturesMixedTBDMarketWatch
    U.S. 10-Yr YieldSteadyMinimalBloomberg
    Natural GasSeparate trajectoryTBDEIA

    Note: Precise intraday price levels should be confirmed via live data feeds. Market relationships across asset classes are dynamic and may not reflect historical patterns. Past correlations do not guarantee future performance.


    Events Ahead

    The following scheduled events and developments may influence oil and energy markets in the sessions ahead. These are presented as items to monitor, not as predictive catalysts:

    • U.S.-Iran Diplomatic Developments: Any further statements from Washington or Tehran regarding the pace and scope of nuclear negotiations could affect the geopolitical risk premium priced into crude, per CNBC
    • IEA Monthly Oil Market Report (full release): Traders may scrutinize the complete report for updated demand forecasts and supply estimates, per Reuters
    • EIA Weekly Petroleum Status Report: U.S. crude inventory data, which markets often monitor for near-term supply signals, available via EIA
    • OPEC+ Communications: Any scheduled or unscheduled commentary from member states regarding production policy could interact with the current price environment, per Bloomberg
    • U.S. Economic Data: Upcoming retail sales and industrial production figures may offer further evidence for or against the IEA’s demand destruction thesis, per Investing.com Economic Calendar
    • Hormuz Shipping Monitoring: Tanker traffic data and any reported incidents at the Strait remain a key variable, per MarketWatch

    Risk Disclaimer: Trading CFDs involves substantial risk and may result in the loss of your invested capital. CFDs are complex instruments and come with a high risk of losing money rapidly due to leverage. You should consider whether you understand how CFDs work and whether you can afford to take the high risk of losing your money. Past performance is not indicative of future results. This content is for informational and educational purposes only and does not constitute investment advice.

  • Oil Falls Below $100 as U.S.-Iran Ceasefire Eases Hormuz Supply Concerns

    Oil Falls Below $100 as U.S.-Iran Ceasefire Eases Hormuz Supply Concerns

    Crude oil prices declined sharply on Monday, with both benchmark contracts falling below the $100 per barrel threshold after the United States and Iran agreed to a two-week ceasefire that includes a commitment to safe passage through the Strait of Hormuz, according to CNBC. The agreement, brokered following diplomatic discussions involving Pakistan’s Prime Minister, has materially reduced near-term fears of a supply disruption through one of the world’s most critical energy chokepoints.


    Context

    The Strait of Hormuz handles an estimated 20% of global seaborne oil trade, and any credible threat to passage through the waterway has historically contributed to elevated risk premiums in energy markets. Prior to the ceasefire announcement, oil prices had moved sharply higher as geopolitical tensions raised the possibility of supply interruptions, according to CNBC.

    The ceasefire has prompted markets to reprice that risk premium lower. Analysts note, however, that a two-week agreement provides a limited window of certainty, and the underlying geopolitical situation remains unresolved. Market participants may weigh the durability of the deal carefully, given the potential for tensions to resurface if negotiations do not progress beyond the initial ceasefire period.

    Bears argue that a reversal of the ceasefire, or any disruption to Hormuz transit, could see the risk premium rebuilt rapidly. Bulls may point to the possibility of a broader diplomatic settlement reducing supply uncertainty over a longer horizon. Both outcomes remain possible at this stage.

    Market relationships between geopolitical risk and energy prices are dynamic and may change over time. Past correlations do not guarantee future performance.


    Key Data

    • WTI Crude: Fell below $100 per barrel, according to CNBC
    • Brent Crude: Also trading below the $100 threshold, per CNBC
    • USO (United States Oil Fund): Expected to reflect intraday losses consistent with the broader crude sell-off; see Reuters for latest ETF data
    • The $100 level has historically attracted market attention as a psychologically significant price point; its breach may draw further scrutiny from traders monitoring medium-term positioning
    • EIA weekly petroleum supply data remains a standing reference point for supply-side developments; latest figures available via EIA

    Market Snapshot

    AssetApprox. LevelChangeSource
    WTI CrudeBelow $100.00Sharply lowerCNBC
    Brent CrudeBelow $100.00Sharply lowerCNBC
    USOReflecting crude declineLowerReuters
    GoldTBCMixed on risk shiftCNBC
    U.S. Equities (Futures)TBCPotentially supportedReuters
    U.S. TreasuriesTBCMonitoring safe-haven flowsReuters

    Note: Levels marked TBC are subject to real-time movement. Refer to live data sources for current pricing.


    Events Ahead

    Traders and analysts may be watching the following developments for further directional cues in energy markets:

    • Ceasefire timeline (two-week window): Any signals of extension, breakdown, or escalation could materially affect the oil risk premium; monitor Reuters for updates
    • EIA Weekly Petroleum Status Report: Scheduled weekly release; available via EIA — inventory data may provide additional context on near-term supply balances
    • U.S.-Iran diplomatic progress: Broader negotiations beyond the ceasefire period remain a key variable; developments could influence medium-term energy price expectations, per CNBC
    • OPEC+ production policy: Any response from producing nations to the price move may be watched; see Reuters for coverage
    • Macro economic calendar: U.S. inflation and Fed communications remain background factors; see Investing.com Economic Calendar for scheduled releases

    Risk Disclaimer: Trading CFDs involves substantial risk and may result in the loss of your invested capital. CFDs are complex instruments and come with a high risk of losing money rapidly due to leverage. You should consider whether you understand how CFDs work and whether you can afford to take the high risk of losing your money. Past performance is not indicative of future results. This content is for informational and educational purposes only and does not constitute investment advice.

  • Gold Prices Fall as Conflicting Iran Signals Reduce Safe-Haven Demand

    Gold Prices Fall as Conflicting Iran Signals Reduce Safe-Haven Demand

    Gold prices retreated during Tuesday’s session as mixed diplomatic signals from Washington surrounding the Iran situation weighed on safe-haven demand, pulling the metal back from elevated levels reached amid heightened geopolitical risk earlier in the week. Spot gold (XAUUSD) declined as reports of ceasefire talks reduced the immediate risk premium that had been built into prices, according to Investing.com.


    Context

    Gold had moved higher in recent sessions on concerns related to a potential closure of the Strait of Hormuz and broader escalation risk in the Middle East. The metal, which has historically attracted demand during periods of geopolitical uncertainty, saw that premium come under pressure as conflicting signals emerged from U.S. officials regarding the status of diplomatic negotiations with Iran.

    According to Investing.com, the market had priced in a geopolitical risk component, and reports suggesting ceasefire discussions were underway contributed to a partial unwinding of those positions. However, analysts noted that the situation remains fluid, with no formal agreement confirmed and the potential for signals to reverse.

    Market participants are weighing two competing dynamics: on one side, easing tensions may continue to reduce safe-haven flows into gold; on the other, any deterioration in diplomatic progress may be associated with renewed upward pressure on prices. The lack of clarity from Washington is contributing to elevated intraday volatility, according to Reuters.

    Gold’s relationship with geopolitical events tends to be asymmetric — prices may rise sharply on escalation fears but do not always retrace fully when tensions subside. Market relationships are dynamic and may change over time, and past correlations do not guarantee future performance.


    Key Data

    Key price levels and metrics, as observed across major data sources:

    • XAUUSD (Spot Gold): Trading in the $3,200–$3,280 range during the session, pulling back from recent highs, according to Reuters
    • GC1! (Gold Futures – Front Month): Tracked closely with spot prices, reflecting similar directional pressure, per CME Group
    • GLD (SPDR Gold Shares ETF): Declined in line with the broader gold complex, according to MarketWatch
    • The metal had been trading at elevated levels relative to its 20-session average, having gained earlier in the week on Strait of Hormuz closure concerns, per Investing.com
    • Near-term technical observers note that the $3,200 level has historically acted as a reference point for short-term positioning, though this is an observational reading and not a predictive signal
    • The $3,300 area, which capped recent gains, may continue to attract attention as a near-term reference level, according to TradingView chart data

    The pullback may reflect profit-taking following the geopolitical-driven run-up, though analysts note that underlying structural demand for gold — including central bank purchasing activity and broader dollar dynamics — has not materially changed, according to Reuters.


    Market Snapshot

    AssetLevel (Approx.)ChangeSource
    XAUUSD (Spot Gold)~$3,230NegativeReuters
    GC1! (Gold Futures)~$3,235NegativeCME Group
    GLD (ETF)Tracking lowerNegativeMarketWatch
    DXY (US Dollar Index)Steady/MixedSlight positiveReuters
    WTI Crude Oil~$60–$62MixedEIA
    US 10-Yr Treasury Yield~4.40%–4.50%Marginal moveReuters
    S&P 500 FuturesModestly positiveSlight positiveCNBC
    Bitcoin (BTC/USD)~$103,000–$105,000MixedCoinDesk

    Disclosure: All levels are approximate intraday readings. Market relationships are dynamic and may change over time.

    The modest recovery in risk sentiment, reflected in equity futures, has been associated with d safe-haven flows across both gold and Treasuries. The U.S. dollar held relatively steady, providing limited directional pressure on dollar-denominated commodities from the FX channel. However, observers caution that the relationship between the dollar and gold is not fixed and may vary depending on the prevailing macro driver, according to FXStreet.


    Events Ahead

    Traders are monitoring the following upcoming catalysts, which may be relevant to gold’s near-term price movements:

    • Iran diplomatic developments: Any formal statements from Washington or Tehran regarding ceasefire progress or breakdown may act as a key short-term factor  for gold’s geopolitical premium — no scheduled timeline, monitor live newswires via Reuters
    • U.S. Federal Reserve communications: Any scheduled Fed speaker remarks on inflation and interest rate policy could influence real yields, which have historically had a relationship with gold pricing — calendar available via the Federal Reserve Events Calendar
    • U.S. economic data releases: Upcoming inflation prints (CPI/PPI) and labor market data may shift rate expectations, with potential knock-on effects for the dollar and gold — schedule available via the Investing.com Economic Calendar
    • EIA Crude Oil Inventory Report: Oil supply data may offer indirect signals regarding Middle East risk sentiment, which could have secondary relevance for gold — published weekly by the EIA
    • Broader risk sentiment: Equity market direction and credit spreads will be worth monitoring as indicators of overall risk appetite, per CNBC

    Market participants should note that geopolitical situations can shift rapidly and without scheduled notice, which may introduce periods of elevated volatility across gold and related instruments, according to Investing.com.


    Risk Disclaimer: Trading CFDs involves substantial risk and may result in the loss of your invested capital. CFDs are complex instruments and come with a high risk of losing money rapidly due to leverage. You should consider whether you understand how CFDs work and whether you can afford to take the high risk of losing your money. Past performance is not indicative of future results. This content is for informational and educational purposes only and does not constitute investment advice.