If you played a drinking game over the last three years where you took a shot every time a CEO uttered the phrase “Generative AI” during an earnings call, you would not be reading this article. You might have needed a long break, or at least a very strong coffee.
We have lived through a period of market history that future economists will either describe as the “Fourth Industrial Revolution” or “The Great Hallucination of the Mid-2020s.” The charts of the semiconductor giants and the hyperscalers have defied gravity, logic, and the basic laws of physics. They have moved up and to the right with the relentless, unthinking confidence of a rocket that has forgotten it needs fuel.
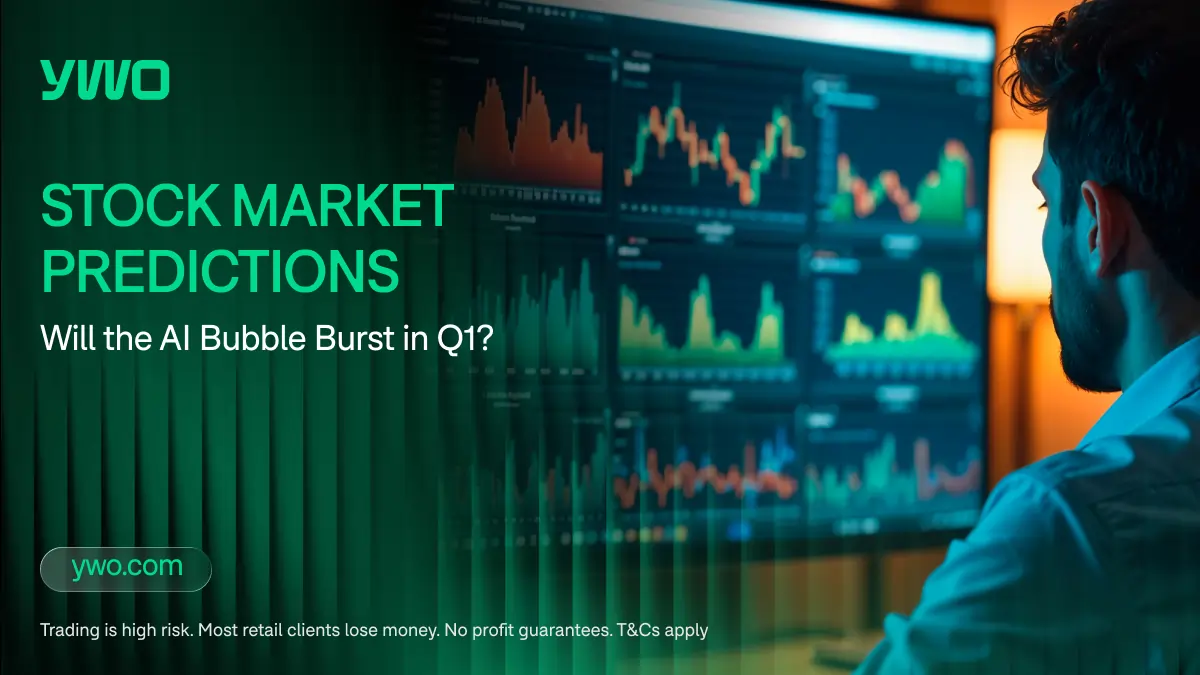
Now, as we stare down the barrel of the first quarter of 2026, a singular, terrifying question hangs over the trading desks of Wall Street, causing portfolio managers to lose sleep and reach for the antacids: could this bethe moment the music stops?
To ask if the “AI Bubble” will burst in Q1 is to misunderstand the nature of bubbles. Bubbles do not just “burst” because they are full. They burst because the story changes. They burst when the collective suspension of disbelief, the magical thinking that allows us to value a company at 50 times its sales, begins to fades, replaced by the cold, hard, and deeply unsexy reality of arithmetic.
Forecasting stock market outcomes for 2026 is a mug’s game, best left to astrologers and television pundits who are never held accountable for their errors. Instead, we are attempting an autopsy of the current market psychology. It is an examination of the structural stresses, the valuation conundrums, and the narrative shifts that may be shaping this precarious moment in financial history.
The Anatomy of a Mania
To understand where we are, we must first admit what we are doing. We may be operating within what resembles a mania. This is not an insult; it is a description of price behavior. When an asset class appears to decouples from historical valuation norms based on the promise of a future paradigm shift, that is often described as a mania.
The railroad boom of the 19th century was a mania. The radio boom of the 1920s was a mania. The internet boom of the late 1990s was the mother of all manias.
In all three cases, the underlying thesis was correct. Railroads did change the world. Radio did connect humanity. The internet did rewrite the operating system of commerce. Being right about the technology, however, did not necessarily save you from losing your shirt if you bought the top.
The “AI Trade” has thus far followed the classic script.
1. Act One was the “Discovery,” where chat-bots stunned the public and Nvidia emerged as a central player in the ecosystem..
2. Act Two was the “Infrastructure Build-Out,” where Microsoft, Google, Amazon, and Meta engaged in a capital expenditure arms race that would make the Pharaohs of Egypt blush, spending substantial sums to build the data centers required to house the new gods of silicon.
3. Act Three, the act we appear to be improvising, is the “Show Me the Money” phase.
This is where bubbles are typically tested. It is easy to sell a dream. It is much harder to sell a subscription. The tension heading into 2026 is the growing gap between the scale of investment poured into AI infrastructure and the still-developing revenue generated from AI applications.
The Capex Conundrum: The Field of Dreams Problem
The bull case for AI stocks in Q1 rests on a theory known as “Field of Dreams” economics: If you build it, they will come.
The hyperscalers (the big cloud providers) have spent the last two years buying every GPU that wasn’t bolted to the floor. They have built gigawatt-scale data centers. They have promised their shareholders that this capital expenditure (Capex) is not spending; but is intended as long-term investment.
The bear case is that they have built a field, and the players are currently stuck in traffic.
In Q1, the global market outlook is searching for evidence of “ROI” (Return on Investment). This is the acronym that kills joy. For two years, investors were happy to hear about “capabilities” and “parameters” and “compute.” Now, they want to see revenue.
The danger for the market in Q1 is not that AI fails. It is that AI adoption may progress more gradually, while stock prices have reflected very optimistic assumptions. If corporate CIOs (Chief Information Officers) decide to tap the brakes on their AI spending, perhaps waiting to see if the Copilot licenses they bought last year actually improved productivity, the revenue growth for the software giants could slow.
If that growth slows, slows, even modestly, valuation multiples could come under pressure. When a stock is priced for near-perfection, “very good” can be reinterpreted negatively by the market.
The Valuation Vertigo
Let us speak frankly about valuations. There are pockets of the market currently trading at multiples that suggest investors believe the companies in question will soon discover a way to monetize breathing.
The argument justifying these valuations is “operating leverage.” The theory goes that AI will allow these companies to significantly reduce costs (or “optimize their workforce,” in corporate speak) while increasing their output, leading to profit margins that would be historically unusual..
If this happens, the stocks could appear attractively priced. If it doesn’t, if AI turns out to be a tool that makes employees 20% more efficient rather than 100% redundant, then the valuations are stretched.
In Q1, we enter the dangerous window of annual guidance. This is the time of year when CEOs have to look into the camera and tell Wall Street what they expect to happen in 2026.
If the guidance is conservative, the algo-bots that run the market will react with the emotional stability of a toddler denied a cookie. We have seen this movie before. A company beats earnings estimates but offers “tepid” guidance, and the stock can decline materially in the after-hours session.
The “Bubble” narrative is fueled by this fragility. A robust market can shrug off a bad quarter. A bubble market interprets a bad quarter as the end of the world.
The “Magical Thinking” of the Retail Herd
No analysis of a bubble is complete without looking at the retail investor. The “dumb money”, a derogatory term that is often statistically accurate, has piled into the AI trade with leverage.
We are seeing the return of behavior that characterized the 2021 meme-stock frenzy. Call option volumes are elevated. Margin debt has increased. There is a prevailing sentiment on social media that stocks only go up, and that any dip is a gift from the universe to be bought with leverage.
This behavior is often viewed as a contrarian signal. When your dentist gives you stock tips about a quantum computing startup, it is usually time to sell. When the taxi driver asks you about “Agentic Workflows,” it is time to buy gold and hide in a bunker.
The retail herd provides the liquidity for the bubble to expand, but they are also the first to panic when it contracts. In Q1, if we see a sharp correction, the unwinding of these leveraged retail positions could intensify the move, potentially increasing short-term volatility.
The Counter-Argument: Why the Party Might Go On
However, to assume the bubble must burst in Q1 is to underestimate the power of the narrative. Bubbles can last much longer than rational observers think possible. As Keynes famously said, “The market can remain irrational longer than you can remain solvent.”
There are structurally bullish forces at play that could keep the AI balloon inflated through Q1 and beyond.
1. The FOMO of the Enterprise: No CEO wants to be the one who missed the AI revolution. Even if they don’t know how to use the tech, fear of falling behind can sustain baseline demand. .I. This can drive continued spending on hardware and software despite unclear near-term returns.
2. The Productivity Miracle: It is entirely possible that the bulls are right. We might be on the cusp of a productivity boom that mirrors the introduction of electricity. If early Q1 data suggests that AI-integrated firms are materially outperforming peers, investor confidence may remain elevated..
3. The Fed Put: Central banks are widely expected to enter easing cycles. Increased liquidity historically supports risk assets. Bubbles rarely burst when money is getting cheaper. They burst when the punch bowl is taken away. With the Fed easing, the punch bowl is being refilled. This liquidity will look for a home, and right now, the only home with a “growth” sign on the front lawn is AI.
The Catalyst: What Could Pop the Pin?
If the bubble is to burst in Q1, it will likely not be because of a single catastrophic event. It will be “death by a thousand cuts.”
Watch the Inventory Channels. If we hear rumors that the hyperscalers are cutting their chip orders because they have too much capacity and not enough demand, the semiconductor sector could face significant pressure.
Watch the Regulatory Hammer. The EU and the US DOJ are circling Big Tech. An antitrust breakup, a massive fine, or a strict new regulation on AI safety could negatively affect the sentiment.
Watch the Energy Grid. We are hitting the physical limits of electricity generation. If data centers cannot get power, they cannot grow. If a major hyperscaler announces they are delaying a project because the local utility company can’t find enough electrons, the infinite growth narrative hits a brick wall.
The Psychology of the Exit
Bubbles are psychological phenomena. They rely on the “Greater Fool Theory”—the idea that I can pay an irrational price for an asset because I will be able to sell it to a greater fool for an even more irrational price tomorrow.
The burst happens when the supply of fools runs out.
In Q1, we are testing the depth of that supply. The institutions, the pension funds, the endowments, are already fully allocated. They cannot buy more. The retail investors are leveraged to the hilt. Who is the marginal buyer?
If the answer is “nobody,” then the price has to fall.
This does not mean AI is a scam. It does not mean the technology is fake. It simply means the price we are paying for it is detached from reality. When the dot-com bubble burst, Amazon lost 90% of its value. Amazon did not disappear. It went on to conquer the world. But if you bought it at the peak in 1999, you waited a decade to break even.
Conclusion: The volatility is the Point
So, will the AI bubble burst in Q1?
The market is a voting machine, not a weighing machine, and right now, the voters are drunk on potential. To bet against the bubble is to stand in front of a freight train and argue about the timetable.
However, the risk-to-reward ratio has shifted. The “easy money” has been made. The “dumb money” is chasing. The “smart money” is hedging.
Q1 2026 will likely be defined by volatility. The smooth, upward ride is over. Price movements could become more pronounced, with earnings surprises or product announcements triggering outsized reactions
For the trader, this is paradise. For the “buy and hold” investor who thinks this is a savings account, it is a minefield.
The bubble might not burst with a bang. It might hiss. It might deflate slowly as the hype meets the grinding friction of reality. Or, perhaps, the robots will really take over, the economy will double in size, and we will look back at today’s prices as a bargain.
But if history is any guide, when everyone agrees that “this time is different,” it is usually the exact moment that history decides to repeat itself. The champagne is still flowing in Q1, but check the bottle. It might be getting light. And remember, the hangover from a vintage mania is always the one that hurts the most.
Final Reminder: Risk Never Sleeps
Heads up: Trading is risky. This is only educational information, not investment advice.