Tag: CFD

  • Fibonacci Retracement: A Forex Trading Blueprint

    Fibonacci Retracement: A Forex Trading Blueprint

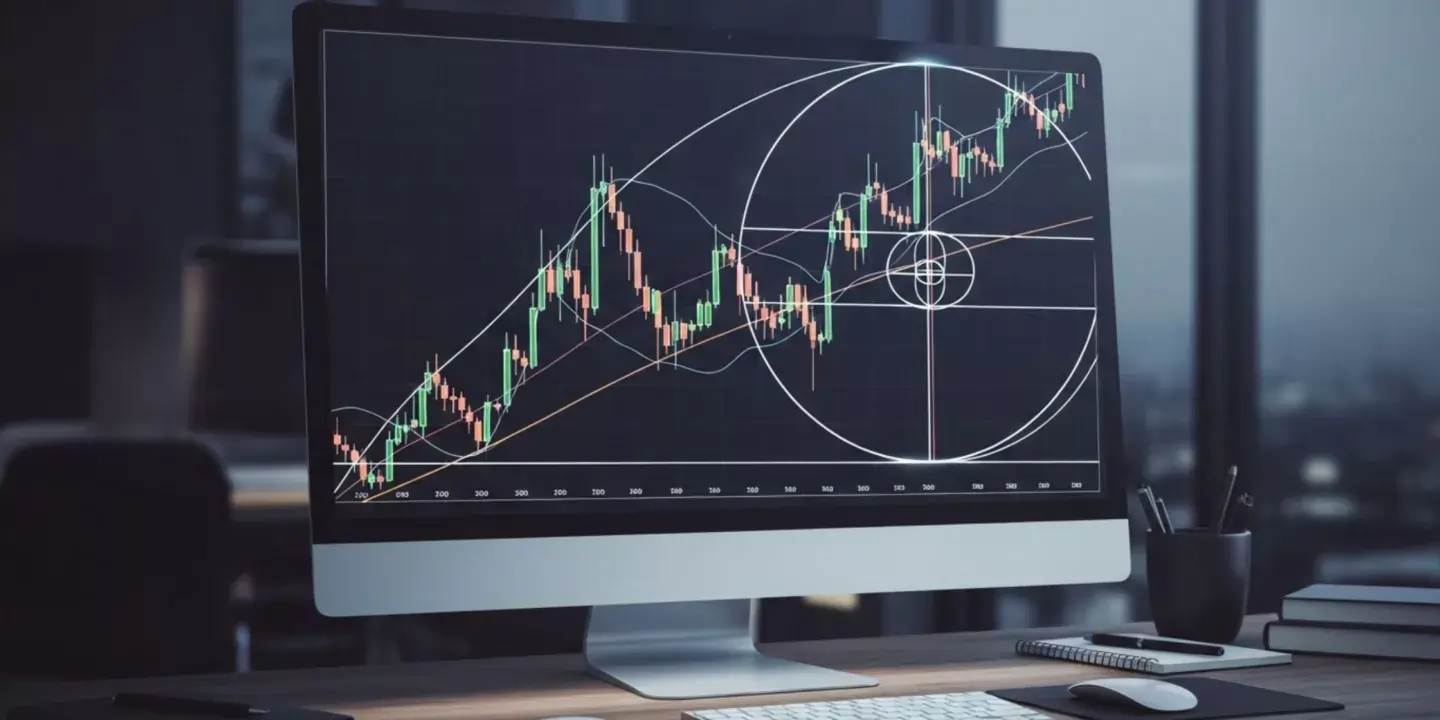
    When trading, the numbers on a chart tell a story. It is a story of rhythm, of ebb and flow, of expansion and contraction. This narrative can sometimes be interpreted through a mathematical sequence introduced to the West in the 13th century by the Italian mathematician Leonardo of Pisa, also known as Fibonacci.

    The Fibonacci sequence is more than a historical curiosity. It is a practical method of technical analysis used to highlight potential areas traders monitor for support and resistance. Understanding its application provides a framework, a structured approach for analysing market behaviour.

    This is not about a magic formula. It is about applying a mathematical principle to gauge market sentiment and identify potential turning points. The sequence itself is simple: 0, 1, 1, 2, 3, 5, 8, 13, 21, and so on, with each number being the sum of the two preceding ones. The power lies in the ratios derived from these numbers.

    These are levels that many traders watch when a market pulls back, as they are often treated as potential zones of interest. This guide provides an in-depth analysis of Fibonacci retracement, progressing from its basic application to advanced strategies, offering a structured framework rather than a guaranteed blueprint for the modern trader.

    What is the Core Principle of Fibonacci Retracement?

    The fundamental idea behind Fibonacci retracement is that after a significant price move in one direction, the price will retrace or pull back a predictable portion of that move before continuing in the original direction.

    Traders use Fibonacci levels to pinpoint these potential reversal points. The tool is drawn by identifying two extreme points on a chart, such as a significant swing high and swing low. The vertical distance between these two points is then divided by the key Fibonacci ratios.

    These key ratios are not arbitrary. They are derived from the mathematical relationships within the Fibonacci sequence.

    • 61.8%: Known as the “golden ratio,” this is derived by dividing any number in the sequence by the number that follows it. As the sequence progresses, this ratio approaches the golden ratio, 0.618.
    • 38.2%: This ratio is found by dividing a number in the sequence by the number two places to its right.
    • 23.6%: This comes from dividing a number by the number three places to its right.

    These ratios translate into horizontal lines on a chart that function as potential support or resistance levels.

    For instance, in a strong uptrend, a pullback to the 38.2% level is often observed. If the price finds support at this level and bounces, it may indicate a continuation of the uptrend. A deeper pullback to the 61.8% level, often referred to as the “golden retracement,” is sometimes monitored, but it is a critical zone for a potential reversal.

    The 50% level, though not an official Fibonacci ratio, is included by most charting platforms because prices have been seen to reverse after retracing half of a prior move.

    Reading the Market: How is Fibonacci Applied in Trending vs. Ranging Markets?

    The effectiveness of Fibonacci retracement is highly dependent on market conditions. The tool is most reliable in a clearly defined trending market, either bullish or bearish. In an uptrend, traders draw the Fibonacci levels from a significant swing low to a subsequent swing high.

    The resulting retracement levels below the high are often viewed as potential support zones where one could look for buying opportunities, anticipating a bounce and continuation of the uptrend. Conversely, in a downtrend, the levels are drawn from a swing high to a swing low.

    The retracement levels above the low are potential resistance zones, which some traders may view as potential resistance zones.

    The story changes in a ranging or sideways market. When a currency pair shows no clear directional trend and its price fluctuates between a defined high and low, applying Fibonacci retracement becomes less effective and often generates misleading signals.

    Ranging markets lack the strong impulse moves that establish the clear swing points needed for a reliable Fibonacci analysis.

    Using the tool in such conditions is a common mistake, as the price is not “retracing” in the context of a larger trend but is simply oscillating.

    In these scenarios, other technical indicators, such as Bollinger Bands or oscillators like the Relative Strength Index (RSI), are often more suitable for identifying overbought and oversold conditions within the range. The key is first to recognise the prevailing market structure. A trending market provides the necessary momentum for Fibonacci levels to act as meaningful inflection points.

    The Trader’s Mind: What is the Psychology of Fibonacci Levels?

    The predictive power of Fibonacci levels is a subject of debate. A prominent argument is that their effectiveness stems from being a self-fulfilling prophecy. Because a vast number of market participants, from individual retail traders to large institutional desks, are aware of and use these levels, they naturally become commonly observed areas of support and resistance.

    When a price approaches a widely watched Fibonacci level, such as 61.8%, a large number of buy or sell orders are triggered.

    This collective action is what causes the price to reverse. A trader seeing a pullback in an uptrend might place a buy order at the 38.2% retracement level with a stop-loss just below the 50% level. Millions of other traders might be doing the same. This flood of buy orders provides the support needed to push the price back up.

    This psychological component is critical. The levels often gain significance because they are widely recognised and used. The numbers themselves have no inherent predictive ability in financial markets.

    Their power is derived from the shared belief and coordinated actions of market participants. This also means that when a key Fibonacci level fails to hold, the subsequent price movement can be swift and decisive.

    A break below a key support level like 61.8% can trigger a cascade of stop-loss orders, adding to the selling pressure and accelerating the downward move. Therefore, a trader using Fibonacci must understand that they are not just trading numbers. They reflect a collective market psychology.

    Confluence is Key: Why Combine Fibonacci with Other Indicators?

    Relying solely on Fibonacci retracement for trading decisions may be limiting. The most robust trading strategies are built on the principle of confluence. Confluence occurs when multiple independent technical indicators highlight the same area, which some traders interpret as a stronger zone of interest.

    Consider a scenario where the 61.8% Fibonacci retracement level of a recent uptrend lines up perfectly with a 200-period moving average.

    The 200-period moving average is itself a significant long-term indicator of support and resistance. When the price pulls back to this combined level, it is seen by some as carrying additional analytical significance.

    Other indicators that pair well with Fibonacci include:

    • Support and Resistance Levels: A historical price level where the market has previously reversed becomes more significant if it aligns with a Fibonacci ratio.
    • Trendlines: A rising trendline in an uptrend can intersect with a Fibonacci retracement level, creating a powerful support zone.
    • Candlestick Patterns: The appearance of a bullish reversal pattern, like a hammer or a bullish engulfing pattern, at a Fibonacci support level can provide further analytical context.
    • Oscillators: An RSI or MACD reading in the oversold territory at a Fibonacci support level may suggest slowing momentum, which traders then interpret alongside Fibonacci.

    When such tools align, they are often used as a filter to help reduce false signals and highlight areas of interest.

    Fibonacci and Your Bottom Line: How Do You Apply Advanced Risk Management?

    Profitability in trading is not just about picking winning entries. It is about disciplined risk management. Fibonacci retracement can provide a structured framework for managing risk. One common application is in setting stop-loss orders.

    When entering a trade at a Fibonacci level, the stop-loss is typically placed just beyond the next level. For example, if a trader enters a long position at the 38.2% retracement level, they might place their stop-loss order just below the 50% or 61.8% level. The idea is that a break through multiple levels could suggest the original trend view is less valid.

    This approach allows for a calculated risk-to-reward ratio. Before entering a trade, a trader can define their exact entry point, their exit point if the trade goes wrong, and their profit target. This allows for precise position sizing. A trader can adjust the size of their position to ensure that the potential loss on any single trade is a small, acceptable percentage of their total trading capital.

    Advanced risk management with Fibonacci also involves scaling into positions. Instead of entering a full position at a single level, a trader might enter a partial position at the 38.2% level, add to it at the 50% level, and add a final portion at the 61.8% level.

    This method spreads out entry points and adjusts the average entry price if the pullback is deeper than anticipated.

    Beyond Retracements: How Do You Use Fibonacci Extensions to Set Profit Targets?

    While Fibonacci retracement helps identify entry points, Fibonacci extensions help define exit points. Extensions are used to project where the price might go following a retracement. They are levels drawn beyond the original price move. The key Fibonacci extension levels are 127.2%, 161.8%, and 261.8%. The 161.8% level is particularly significant, as it is the golden ratio applied to price projection.

    To use Fibonacci extensions, a trader needs three points: the start of a move, the end of that move, and the end of the subsequent retracement. For an uptrend, this would be a swing low, a swing high, and the low of the pullback.

    The extension tool then projects potential profit targets above the swing high. For example, after a price bounces off the 50% retracement level, a trader might set their first profit target at the 127.2% extension and a second target at the 161.8% extension.

    These extension levels can act as reference zones where traders may consider taking partial or full profits, depending on their plan.

    Time is on Your Side: Does Fibonacci Work Across Different Trading Timeframes?

    The beauty of the Fibonacci sequence is its fractal nature. The patterns and ratios repeat across all scales. This means that Fibonacci retracement and extension tools can be applied to any timeframe, from a one-minute chart for a scalper to a weekly or monthly chart for a long-term position trader.

    The principles remain the same. On a 15-minute chart, a trader might use Fibonacci to analyse a price swing that occurred over a few hours. On a daily chart, the same tool could be used to analyse a trend that has been developing for months.

    The consistency across timeframes is a powerful feature. It allows traders to align their entries with the larger market trend. For instance, a long-term position trader might identify a major uptrend on the weekly chart and see that the price is pulling back to the 38.2% retracement level.

    A swing trader, looking at the daily chart, might wait for the cost to hit that same weekly support level and then look for a bullish entry signal on the daily chart. A day trader could go even further, waiting for the price to reach this central support zone and then using a 5-minute chart to time their entry with precision.

    This multi-timeframe analysis is one approach traders may use to provide context for shorter-term setups.

    Does It Actually Work? How to Backtest Your Fibonacci Trading Strategy

    No trading strategy should be deployed with real capital until it has been thoroughly backtested. Backtesting is the process of applying a trading strategy to historical price data to determine its effectiveness.

    For a Fibonacci-based strategy, this involves revisiting past charts and simulating trades based on predefined rules.

    Some analyses have questioned the standalone reliability of the tool. Arthur Merrill in Filtered Waves determined there is no reliably standard retracement, a conclusion that suggests price volatility may be a more significant factor than a mystical sequence.

    The appearance of retracements can sometimes be ascribed to the random fluctuations inherent in market price action.

    This does not mean the tool is useless, but it highlights the importance of using it in conjunction with other tools. The process for backtesting a refined, confluence-based Fibonacci strategy is systematic:

    1. Define Strict Rules: First, establish a clear and unambiguous set of rules for your strategy.
    2. Select a Market and Timeframe: Choose the currency pair and the chart timeframe you intend to trade.
    3. Gather Historical Data: Use a trading platform that allows you to scroll back through historical price data.
    4. Simulate Trades: Manually review the data, bar by bar, and identify every setup that meets your trading rules.
    5. Analyse the Results: After simulating a large number of trades (at least 100), analyse the data. Calculate the win rate, the average win, the average loss, and the risk-to-reward ratio.

    This process provides an objective measure of a strategy’s historical performance. It might reveal that specific rules are not profitable and need adjustment.

    Backtesting can help traders gain more familiarity with their strategy and refine their approach based on what the historical data reveals.

    Fibonacci in Action: Real-World Case Studies of Winning and Losing Trades

    Theory is one thing; real-world application is another. Examining case studies reveals how these principles are applied in real-world markets.

    Case Study 1: A Winning Trade in a Trending Market

    Consider the EUR/USD currency pair during a consistent uptrend. After identifying a significant high and low, a trader applies Fibonacci retracement levels. The price retraces to the 61.8% level and begins to stabilise.

    The trader then notices a bullish candlestick pattern and an oversold signal on the RSI, prompting an entry. This confluence of indicators highlighted a potential area of support. The trade outcome aligned with the expectation of the trend continuing.

    This example illustrates how Fibonacci retracement can be combined with other tools to help identify areas of interest, though outcomes can vary depending on market conditions.

    Case Study 2: A Losing Trade in a Choppy Market

    Now, imagine a currency pair in a choppy, sideways market. The price has been oscillating without a clear direction for several days. A trader, eager to find a setup, identifies what appears to be a minor downtrend within the range. They apply the Fibonacci retracement tool to this small move and wait for a pullback. The price rallies to the 50% retracement level.

    The trader enters a short position, anticipating continuation of the minor trend

    However, because the broader market lacked directional momentum, the retracement level offered limited guidance. The position did not play out as anticipated.

    This example shows how applying Fibonacci retracement in non-trending conditions may reduce its effectiveness, underscoring the importance of context. For more on this, see mistakes to avoid.

    Closing Remarks

    Fibonacci retracement is not a predictive machine. It is a framework for analysis. It provides structure to the apparent chaos of price action. Its lines on a chart are reference points,that some traders use potential zones where the psychology of the market might shift and cause a trend to resume or reverse.

    These levels gain significance from the sheer number of traders who watch them, transforming a mathematical curiosity into a commonly applied tool for market analysis

    The framework, therefore, is useless without a skilled architect. The trader’s discipline in applying the tool within a trending market, confirming signals with other indicators, managing risk with precision, and backtesting every assumption determines the outcome. 

    A Final Word About Risk

    No indicator or trading strategy guarantees profit. Forex trading involves substantial risk, and you should never invest capital that you cannot afford to lose. 

    The Fibonacci retracement tool is a method for identifying potential opportunities, not a crystal ball. Its effectiveness is tied to a disciplined trading plan, strong risk management, and the confirmation of other indicators. 

    Every single trade you take must have a predefined stop-loss to protect your account. The market’s direction is never certain. Your risk, however, must always be defined and controlled.

    Your long-term success as a trader depends not on your winning trades, but on how you manage your losing ones.

    Approach every setup with this principle at the forefront of your mind.

  • Fibonacci & Golden Ratio: A Mathematical Perspective in Trading

    Fibonacci & Golden Ratio: A Mathematical Perspective in Trading

    From the spiral of a seashell to the grandeur of ancient architecture, the Golden Ratio (Phi) has fascinated thinkers for millennia. But what if this universal constant, this mathematical concept, may offer a way to interpret market movements in CFD trading?

    At YWO.com, we explore how Fibonacci trading principles offer a profound lens through which to view financial markets, providing traders with an alternative mathematical perspective.

    This article will guide you through the Fibonacci sequence and its powerful application in technical analysis Fibonacci.

    We’ll move from theoretical underpinnings to practical trading strategies, illustrating how these ratios are often used to identify potential support and resistance levels, suggest possible price zones, and inform broader risk management approaches.

    Decoding the Golden Ratio & Fibonacci Sequence

    The journey into Fibonacci trading begins with understanding its core components: the Golden Ratio and the Fibonacci sequence.

    What is the Golden Ratio (Phi) and Why Does it Matter?

    The Golden Ratio, approximately 1.618 (and its inverse, 0.618), is a number derived from a unique mathematical relationship where the ratio of the sum of two quantities to the larger quantity is equal to the ratio of the larger quantity to the smaller one.

    Represented by the Greek letter Phi (Φ), this proportion appears ubiquitously in nature, art, and even human anatomy. In financial markets, some analysts believe that market psychology and collective behavior can appear to align with these ratios, though this remains an interpretive framework.

    The Fibonacci Sequence: Nature’s Secret Code

    The Fibonacci sequence, discovered by Leonardo Fibonacci, is a series of numbers where each number is the sum of the two preceding ones (0, 1, 1, 2, 3, 5, 8, 13, 21, 34, …).

    What makes this sequence critical for trading with Fibonacci is the relationship between its numbers. As you progress, the ratio of any number to its preceding number approaches 1.618 (e.g., 34/21 ≈ 1.619), while the ratio to the number two places before it approaches 2.618 (e.g., 34/13 ≈ 2.615).

    These ratios, particularly 0.618 (the inverse of 1.618), 0.382, and 0.236, form the bedrock of Fibonacci retracement and Fibonacci extension tools.

    The Psychological & Mathematical Basis of Fibonacci in Markets

    Why do technical analysis Fibonacci tools are often applied in Forex or stock market environments? It’s largely attributed to human psychology and the collective behavior of traders.

    Markets, driven by fear and greed, often exhibit herd dynamics that may lead to recurring reactions at certain price points. These reactions are sometimes observed near Fibonacci levels.

    As market prices move, they typically don’t move in a straight line. Instead, they exhibit market cycles of expansion, contraction, and retracement. After a significant price move, markets often “correct” or “retrace” a portion of that move before continuing in the original direction.

    These retracements are often monitored at the retracement levels of 38.2%, 50%, and 61.8%, which are linked to the Fibonacci sequence.

    Core Fibonacci Tools in Technical Analysis

    Using Fibonacci tools in technical analysis typically involves understanding their main applications

    Fibonacci Retracement: Highlighting Potential Support & Resistance

    The Fibonacci Retracement Tool is arguably the most popular Fibonacci trading instrument.

    It is used by traders to identify potential areas of support and resistance where price might react. To draw Fibonacci Retracements accurately, you connect two extreme points: a swing high and a swing low for an uptrend, or a swing low and a swing high for a downtrend.

    The most watched key retracement levels are:

    • 23.6%: A minor retracement, often seen in strong trends.
    • 38.2%: A significant level; often a first point of interest for buyers/sellers.
    • 50%: While not a direct Fibonacci number, it represents the midpoint of a move and is widely followed as a psychological level.

    A Final Word on Risk
    No indicator or trading strategy guarantees profit. Forex trading involves substantial risk, and you should never invest capital that you cannot afford to lose. 

    The Fibonacci retracement tool is a method for identifying potential opportunities, not a crystal ball. Its effectiveness is tied to a disciplined trading plan, strong risk management, and the confirmation of other indicators. 

    Every single trade you take must have a predefined stop-loss to protect your account. The market’s direction is never certain. Your risk, however, must always be defined and controlled.

    Your long-term success as a trader depends not on your winning trades, but on how you manage your losing ones.

     Approach every setup with this principle at the forefront of your mind.

  • Fibonacci Analysis: 5 Common Mistakes & How to Use It Effectively

    Fibonacci Analysis: 5 Common Mistakes & How to Use It Effectively

    Fibonacci analysis is widely used in technical trading, and when applied carefully, it can offer a structured way of examining potential market levels.

    The “golden ratio”, with its ties to natural patterns, is often referenced as a framework for identifying possible areas of support and resistance in markets such as forex, indices, and commodities.

    Yet, like any potent tool, it requires careful application; missteps in Fibonacci analysis can reduce effectiveness and lead to inconsistent results.

    This guide will explore the 5 common Fibonacci errors that consistently trip up traders, from beginners to those with some experience.

    More importantly, it outlines practical approaches that may help in avoiding these pitfalls, supporting a more disciplined use of Fibonacci techniques within broader market analysis.

    The Foundation: A Quick Refresher on Fibonacci in Trading

    Before we delve into the errors, let’s briefly revisit the core principles. Fibonacci analysis is a technical analysis method that uses sequences of numbers identified by the 13th-century mathematician Leonardo Pisano, known as Fibonacci.

    What is Fibonacci and Why Traders Use It

    The Fibonacci sequence in trading is a series of numbers where each number is the sum of the two preceding ones (e.g., 0, 1, 1, 2, 3, 5, 8, 13, 21, 34…). When we derive ratios from these numbers, specific percentages emerge that are often observed in financial markets.

    Traders use these ratios to highlight potential areas of support and resistance, monitor possible price levels, and assess retracements or extensions.

    It’s a cornerstone of technical analysis, applicable across forex trading, stock market indices, and commodities in CFD trading.

    Understanding Key Retracement and Extension Levels

    The most commonly used Fibonacci retracement levels are 23.6%, 38.2%, 50%, 61.8%, and 78.6%. These levels suggest where a price pullback may potentially pause before the original trend resumes.

    For Fibonacci extension, popular levels include 127.2%, 161.8%, 200%, and 261.8%, which are often used to project potential price areas once a market moves beyond a prior high or low.

    Mistake 1: Ignoring the Overarching Trend & Market Context

    One of the most frequent common Fibonacci errors is applying Fibonacci levels in isolation, without considering the broader market direction. This is akin to navigating a ship without knowing the ocean’s currents.

    Why ‘Blind’ Fibonacci can be misleading

    A trader might identify a 61.8% retracement level on a chart, but if the market’s overarching trend is strongly bearish, that seemingly perfect level could be easily breached.

    Fibonacci analysis mistakes often stem from a lack of market context, resulting in trades that move against prevailing momentum. The market’s rhythm, driven by fundamental news or strong momentum, can easily overshadow individual indicator signals.

    Solution: Always Confirm with Macro Trend Analysis & Price Action

    The most effective way to use Fibonacci is with the trend. Always identify the dominant trend first, whether bullish or bearish, using tools like moving averages, trend lines, or higher timeframe analysis.

    Then, look for Fibonacci retracements within that trend to find potential entry points. Confirm these levels with price action trading signals, such as strong candlestick patterns or rejection from a trend line. This combined approach may improve the consistency of analysis.

    For broader perspective, integrating global economic indicators can also support trend evaluation as discussed at Bloomberg Markets.

    Mistake 2: Incorrectly Drawing Fibonacci Levels

    This might sound basic, but incorrect Fibonacci levels are a primary source of frustration. Many traders struggle with identifying the correct swing high and swing low to anchor their Fibonacci tool.

    The Critical Error of Misplaced Anchor Points

    Drawing Fibonacci retracements requires selecting a significant swing low and a significant swing high (for an uptrend pullback) or vice versa (for a downtrend pullback).

    Traders often make the mistake of picking minor fluctuations, arbitrary points, or using a range that isn’t reflective of a clear impulse move. This leads to Fibonacci retracement errors where the calculated levels are irrelevant to actual market movement.

    Solution: Master the Swing Highs and Lows with Precision

    A ‘swing high’ is typically a high point with at least two lower highs on either side. A ‘swing low’ is a low point with at least two higher lows on either side. Practice identifying these definitive pivot points on various timeframes.

    For an uptrend, draw from the swing low to the swing high. For a downtrend, draw from the swing high to the swing low. The accuracy of your anchor points plays a major role in the relevance of your Fibonacci analysis.

    Stock market analysis on computer screen - Fibonacci Tool

    Mistake 3: Relying Solely on Fibonacci without Confluence

    Just as a single instrument rarely forms an entire orchestra, a single indicator like Fibonacci rarely provides a complete trading signal. This is a crucial pitfall in avoiding Fibonacci pitfalls.

    The Danger of Single-Indicator Syndrome

    Many traders fall into the trap of using Fibonacci as their sole decision-making tool. They see a price hit a 61.8% retracement and immediately initiate a trade.

    However, markets are complex, influenced by multiple factors. Relying only on Fibonacci, without additional confirmation, significantly increases the risk of missed opportunities, especially during volatile conditions.

    Solution: Combine with Support/Resistance, Candlesticks, and Volume for Confirmation

    Successful trading Fibonacci effectively involves seeking confluence. This means looking for multiple technical indicators or patterns aligning at or near a Fibonacci level. For example, does a 61.8% retracement level coincide with a historical support/resistance zone?

    Is there a candlestick reversal pattern forming at that level? Is volume Fibonacci supporting the potential reversal? Combining Fibonacci with other tools can create stronger confirmation signals.

    Mistake 4: Inappropriate Timeframe Application

    The market’s fractal nature means that patterns repeat across different timeframes. However, a Fibonacci analysis valid on a daily chart will likely be meaningless on a 5-minute chart.

    Why a Daily Chart’s Fibonacci Won’t Work on a 5-Minute Chart

    Applying Fibonacci levels drawn from a broad, multi-day price move to a short-term, intraday chart is a classic Fibonacci analysis mistake.

    The underlying market drivers, participant types, and price noise differ significantly between timeframes. Fibonacci levels are most effective when applied to a timeframe consistent with your overall trading strategy and horizon.

    For instance, long-term analysis is often conducted on weekly or monthly charts, while shorter-term traders may look at 15-minute or 1-hour charts.

    Solution: Align Your Fibonacci Analysis with Your Trading Style & Timeframe

    Determine your primary trading timeframe first. Are you a swing trader holding positions for days? Focus on 4-hour or daily charts.

    Are you a scalper looking for quick trades? Use 1-minute or 5-minute charts for your time frames Fibonacci analysis, but always be aware of the higher timeframe trend. Consistency in timeframe selection supports more coherent analysis.

    [Insert Chart: Fibonacci on different timeframes showing varying validity, e.g., a Daily chart showing a clear 61.8% bounce, and a 5-minute chart showing the same Fibonacci levels being disregarded by intraday noise]

    Mistake 5: Over-Trading and Letting Emotions Dictate Fibonacci Trades

    Even with perfect analysis, trading psychology can derail a trader’s success. The desire to find a setup, or the fear of missing out (FOMO), often leads to forced Fibonacci trades.

    The Psychological Trap of Forcing Fibonacci Setups

    After diligently learning how to use Fibonacci correctly, traders can become overzealous, seeing Fibonacci setups everywhere. This often results in over-trading, where traders take lower-probability trades just because they’ve identified a Fibonacci level.

    This emotional bias, coupled with a lack of discipline, can quickly erode capital. Understanding the role of greed and fear is an important part of risk awareness in CFD trading.

    Solution: Develop a Trading Plan and Stick to Risk Management Principles

    A solid trading plan is a helpful defence against emotional trading. It should clearly define your entry criteria (including Fibonacci confluence), exit strategy, and strict risk management Fibonacci rules.

    Many traders use predefined stop-loss and take-profit levels to manage exposure. Position sizing and limiting risk on each trade are also widely emphasized as key components of long-term risk control.

    For instance, place a stop-loss just beyond a significant Fibonacci retracement level if you anticipate a bounce. Adhering to these principles is essential for long-term survival and profitability. Gain deeper insights into managing your mental game with our guide on (FOMO) Silently Wrecking Your Account.

    Learn more about risk management from financial authorities like the Financial Times.

    Advanced Strategies: Elevating Your Fibonacci Analysis

    Once you’ve understood the basics and avoided these common pitfalls, you may explore more advanced uses of Fibonacci.

    Identifying Fibonacci Clusters and Confluence Zones

    Look for areas where multiple Fibonacci levels from different price swings or different timeframes converge. These “clusters” are often monitored as stronger potential support or resistance zones.

    Integrating Fibonacci with Elliott Wave Theory for Deeper Insights

    Elliott Wave Theory postulates that markets move in predictable wave patterns driven by collective psychology. Fibonacci ratios are intrinsically linked to Elliott Wave, providing precise measurements for wave lengths and retracements.

    This combination is used by some analysts to study market structure and possible price movement scenarios.

    Leveraging Fibonacci for Precise Stop-Loss and Take-Profit Placement

    Fibonacci extension levels are excellent tools for identifying potential take-profit targets, especially in strong trends. Similarly, placing stop-losses just beyond key retracement levels can offer logical and effective risk control.

    If a significant Fibonacci level is broken, it may signal a shift in sentiment, prompting traders to reassess their analysis.

    rade setup with Fibonacci SL/TP showing an entry at a 61.8% retracement, with SL below the 78.6% and TP at 161.8% extension.

    Conclusion: Applying Fibonacci Thoughtfully

    Fibonacci analysis is commonly referenced in the technical trader’s arsenal, yet its usefulness can be limited by avoidable Fibonacci mistakes.

    By recognizing and addressing frequent errors – such as overlooking the trend, misplacing anchor points, relying on it in isolation, applying it across inconsistent timeframes, or letting emotions drive decisions – you may improve the consistency and structure of your analysis.

    Key Takeaways for Applying Fibonacci

    1. Always confirm the trend before applying Fibonacci.
    2. Use clear swing high/low identification for drawing.
    3. Seek confluence with other indicators like support/resistance and price action.
    4. Align Fibonacci with your trading timeframe.
    5. Adhere to a strict trading plan and risk management.

    With careful use, Fibonacci analysis can support a more disciplined approach within technical analysis.


    Summary/TL;DR

    • Mistake 1: Ignoring Trend. Applying Fibonacci without considering the overarching market trend can reduce reliability. Approach: confirm with macro trend analysis and price action.
    • Mistake 2: Incorrect Drawing. Misplacing anchor points for Fibonacci retracement or extension reduces relevance. Approach: Focus on identifying significant swing highs and lows with precision.
    • Mistake 3: No Confluence. Relying solely on Fibonacci signals without additional confirmation. Approach: Combine with support/resistance, candlestick patterns, and volume for stronger signals.
    • Mistake 4: Inconsistent Timeframe. Using Fibonacci levels from one timeframe on another, inconsistent timeframe. Approach: Align your Fibonacci analysis with your specific trading style and timeframe.
    • Mistake 5: Emotional Over-trading. Forcing Fibonacci setups or trading without discipline. Approach: Apply a trading plan and maintain clear risk management rules.

    A Final Word on Risk
    No indicator or trading strategy guarantees profit. Forex trading involves substantial risk, and you should never invest capital that you cannot afford to lose. 

    The Fibonacci retracement tool is a method for identifying potential opportunities, not a crystal ball. Its effectiveness is tied to a disciplined trading plan, strong risk management, and the confirmation of other indicators. 

    Every single trade you take must have a predefined stop-loss to protect your account. The market’s direction is never certain. Your risk, however, must always be defined and controlled. Your long-term success as a trader depends not on your winning trades, but on how you manage your losing ones.

     Approach every setup with this principle at the forefront of your mind.


    Frequently Asked Questions About Fibonacci Analysis

    Q: What’s the ‘Golden Ratio’ in trading, and how does it relate to Fibonacci?

    A: The ‘Golden Ratio’ is approximately 1.618 (or its inverse, 0.618), derived from the Fibonacci sequence. It appears naturally in many aspects of the universe and is sometimes referenced in financial markets.

    In trading, levels such as 61.8% retracement and 161.8% extension are based on this ratio and are widely monitored, though not guaranteed indicators

    Q: Can Fibonacci analysis predict market reversals with 100% accuracy?

    A: No. There is no technical analysis tool that can predict market reversals with 100% accuracy. Fibonacci levels are probabilities, not certainties.

    They indicate potential areas where price might react. Always use them in conjunction with other confirmation signals and a robust risk management strategy.

    Q: How often should I adjust my Fibonacci levels on a chart?

    A: Fibonacci levels are often adjusted when a new significant swing high or swing low forms, establishing a new clear impulse move.

    As the market evolves, so too should your drawn Fibonacci ranges to remain relevant to the current price action.

    Q: Are there specific market conditions where Fibonacci works best?

    A: Fibonacci analysis tends to work best in trending markets where clear impulse waves and corrective retracements are visible.

    In choppy, sideways, or highly volatile and unpredictable markets without clear trends, Fibonacci levels can be less reliable.

    Q: What other tools complement Fibonacci for CFD trading?

    A: For CFD trading, Fibonacci analysis is powerfully complemented by tools such as support and resistance levels, trend lines, moving averages, candlestick patterns, volume indicators, and momentum oscillators like the RSI or MACD.

    Combining these creates a comprehensive analytical framework.

  • Partner with YWO: Grow Your Business

    Partner with YWO: Grow Your Business

    The right partnership does more than open doors. It builds them. For years, businesses have formed strategic alliances to enter new markets, share resources, and build stronger brands. In the financial sector, the Introducing Broker (IB) model became a cornerstone of this approach.

    IBs act as vital intermediaries, connecting traders to brokerage firms and the global markets. It is a model built on mutual benefit. Brokers acquire new clients. Traders get personalised service. The IB earns a commission for the referral.

    This relationship, when it works, is a powerful engine for all three parties. But the model’s success depends entirely on the foundation of the partnership program. Many programs offer a simple commission.

    A true growth partnership provides the tools, transparency, and support needed to build a sustainable business. The distinction is essential. One is a referral fee. The other is a business accelerator. This is where the YWO partnership program makes its case. YWO built its program not for its own convenience, but for the partner’s success.

    A Foundation of Transparency

    Trust in any business partnership is paramount. In the financial industry, it is non-negotiable. Partners need a clear view of their business operations, from client acquisition to final payment. A lack of clarity creates friction and undermines growth. YWO addresses this directly by building its program on a principle of total visibility.

    The company offers partners a clear window into their performance. All reporting, client tracking, and payout information is accessible through a dedicated portal. There are no lengthy requests or unexplained delays.

    This system removes ambiguity. Partners see conversions, commissions, and client activity as it happens. The math is straightforward, not hidden in a black box.

    This commitment to transparency extends to payments. The program offers daily payouts, free of charge, providing partners with consistent access to their earnings. Payments are available through multiple methods, including cryptocurrency, cards, and e-wallets, offering the flexibility modern businesses require.

    This reliable payment structure ensures partners focus on growing their network, not on chasing invoices.

    The Tools for Growth

    A partnership program is only as strong as the opportunities it creates. YWO’s approach is to provide a flexible framework that supports different business models and ambitions. The program is not a one-size-fits-all solution. It is a set of tools designed for growth.

    It starts with flexible commission models. Partners can choose a structure that aligns with their goals. One option is a pure revenue share, offering up to 50% of the revenue from every trade a client makes. This model provides a continuous income stream throughout the client’s lifetime.

    Another option combines an upfront payment for client acquisition with an ongoing revenue share. This hybrid approach strikes a balance between immediate income and long-term earnings. For larger networks or businesses with unique needs, YWO offers custom terms tailored to their specific operations.

    Support is another critical component. A partner’s success is linked to the broker’s responsiveness. YWO provides partners with 24/7 access to Partner Success Managers. These are not generic support agents. They are dedicated experts who understand the partner’s business and work to optimise their campaigns.

    This hands-on support is complemented by practical marketing assistance, including exclusive branded merchandise and client giveaways to help partners engage their audience. The underlying trading environment is also a key factor. A partner’s reputation is tied to the quality of the service their clients receive.

    YWO provides a reliable platform with 99.9% uptime and an average execution speed of under 100 milliseconds. This reliability helps partners build trust with their clients.

    A Program for Every Specialist

    A diverse group of professionals and influencers in the financial landscape. Each group has a unique audience and a distinct approach to doing business. YWO designed its program to cater to this diversity, providing a viable path to revenue for different types of partners.

    Introducing Brokers (IBs) are a primary focus. For IBs managing a client base, the program offers the infrastructure to scale. The transparent tracking and reliable payouts allow IBs to manage their business efficiently.

    The support from dedicated managers helps them expand their reach and grow their client network.

    Affiliate Marketers also find a home. For those who convert web traffic into revenue, the lifetime commissions on offer create a source of long-term income. The provided marketing assets and transparent conversion tracking give affiliates the data they need to refine their strategies and improve performance.

    The program also extends to other specialists. Website owners and publishers with financial content can monetise their work using YWO’s conversion tools. Trading signal providers can turn their expertise into a revenue stream by connecting their followers with a reliable broker. Financial influencers and content creators can transform their audience into a sustainable income stream, backed by a system that transparently tracks their earnings.

    The Path to Partnership

    Joining a new program often involves complex paperwork and lengthy approval processes. YWO streamlined its onboarding process to a three-step approach, designed to get partners up and running quickly.

    The first step is a simple registration that takes only a few minutes. The second step involves receiving unique tracking links, marketing assets, and any necessary onboarding support. The third and final step is to begin promotion and start earning. Commissions are tracked in real-time, providing new partners with immediate feedback on their efforts.

    This straightforward process reflects the program’s overall philosophy. It is about removing obstacles and providing a direct path to growth. For individuals and businesses seeking to establish a foothold or expand their presence in the financial markets, a strategic partnership is crucial.

    It provides the foundation, the tools, and the support needed to build something lasting.

  • Understanding Leverage and Margin in CFD Trading

    Understanding Leverage and Margin in CFD Trading

    A new trader deposits funds into his account. He feels prepared. He has followed the markets for months, read analysis, and developed a strategy. He opens his first trade on a popular currency pair, risking a small portion of his $2,000 capital. The market moves in his favour by one per cent, a solid daily move. He closes the position and looks at his profit: $20.

    He feels a sense of disappointment. At this rate, building a substantial account would take a lifetime. He wonders how other traders generate significant returns from these fractional market movements. The answer lies in two of the most fundamental concepts in CFD trading: leverage and margin.

    These tools are available to all traders, but their proper use requires knowledge and discipline. Understanding how they work together is essential for managing risk and pursuing your trading goals.

    What Are Contracts for Difference?

    Contracts for Difference, or CFDs, are financial instruments. They allow you to speculate on the price movements of assets without owning the assets themselves. When you trade a CFD on gold, for example, you do not buy physical gold. Instead, you enter a contract with a broker to exchange the difference in the asset’s price from the time you open the position to the time you close it.

    If your price prediction is correct, you make a profit. If the price moves against your prediction, you incur a loss. This structure provides flexibility for trading on both rising and falling markets. You simply buy if you expect the price to go up or sell if you expect the price to go down. The simplicity of this mechanism makes CFDs a popular choice for traders seeking exposure to a wide range of global markets, including forex, indices, commodities, and stocks.

    Understanding Leverage

    Leverage gives you the ability to control a large position with a small amount of capital. Your broker provides the remaining funds. This mechanism amplifies your market exposure. Leverage is expressed as a ratio, such as 10:1 or 30:1. A 10:1 leverage ratio means that for every $1 of your own money, you control $10 in the market.

    Consider a practical example. You have $1,000 in your trading account. You wish to open a position on a stock CFD valued at $10,000. With a leverage ratio of 10:1, you only need to put up $1,000 of your own funds. Your broker effectively lends you the other $9,000. This allows you to command a position ten times the size of your committed capital.

    The primary effect of leverage is the magnification of outcomes. If the stock price increases by 2%, your profit is calculated on the full $10,000 position. A 2% gain on $10,000 is $200. Since your own capital commitment was $1,000, this represents a 20% return on your investment. Without leverage, a 2% gain on your $1,000 would yield only $20.

    This amplification also applies to losses. If the stock price falls by 2%, your loss is also calculated on the total $10,000 position. A 2% loss is $200. This amounts to a 20% loss of your invested capital. Leverage is a double-edged sword. It increases your potential returns, but it also elevates your potential risk in equal measure. Responsible use of this tool is a cornerstone of a sound trading plan.

    The Role of Margin

    Margin is the amount of money you must deposit and hold in your account to open and maintain a leveraged trading position. This is not a fee or a transaction cost. Think of margin as a good-faith deposit. Your broker holds your margin to cover any potential losses your position might incur. The amount of margin required depends directly on the size of your trade and the leverage ratio you use.

    There are two main types of margin to be aware of.

    Initial Margin: This is the deposit required to open a position. In our previous example, to open the $10,000 position with 10:1 leverage, the initial margin required is $1,000. Your trading platform will show this amount before you confirm the trade.


    Maintenance Margin: This is the minimum amount of equity you must maintain in your account to keep your leveraged position open. Equity is the total value of your account, including the profit or loss from open positions. Brokers set a maintenance margin level, often as a percentage, to protect both you and them from excessive losses.

    If the market moves against you, your account equity will decrease. Should your equity fall below the maintenance margin level, your broker will issue a margin call. This is a notification that requires your attention.

    You either need to deposit more funds into your account to bring your equity back above the level necessary, or you must close some or all of your positions to reduce your margin requirement. If you fail to act, the broker reserves the right to close your positions to prevent further losses automatically. This process, known as a stop out, protects your account from falling into a negative balance.

    The Connection Between Leverage and Margin

    Leverage and margin have an inverse relationship. The higher the leverage you use, the lower the initial margin required to open a position of a specific size.

    This connection is mathematical and direct. Margin is calculated as a percentage of the full position size, and that percentage is the inverse of the leverage ratio. A 10:1 leverage ratio corresponds to a 10% margin requirement (1/10). A 30:1 leverage ratio corresponds to a 3.33% margin requirement (1/30).

    Let’s look at a $20,000 position in a currency pair.

    • With 10:1 leverage, the required initial margin is 10% of $20,000, which is $2,000.
    • With 30:1 leverage, the required initial margin is 3.33% of $20,000, which is approximately $667.

    The appeal of high leverage is clear. A smaller margin requirement allows you to open larger positions with the same amount of capital or to open multiple positions simultaneously. This flexibility also brings increased risk. A smaller margin deposit means your position has a smaller buffer against adverse market movements before a margin call is triggered.

    A position with lower leverage requires more upfront capital but is more resilient to market fluctuations. Your choice of leverage should always align with your risk tolerance and overall trading strategy.

    Managing Risk with Leverage and Margin

    Using these tools effectively comes down to disciplined risk management. Your primary goal is to protect your trading capital. Several strategies and tools are available to help you manage the risks associated with leveraged trading. Implementing them is a mark of a serious trader.

    Use Stop-Loss Orders

    A stop-loss order is an instruction you give your broker to automatically close a position if the price reaches a certain level. This defines your maximum acceptable loss on a trade before you even enter it. For a long (buy) position, you set a stop-loss below the entry price. For a short (sell) position, you set it above the entry price. Using a stop-loss on every leveraged trade is a fundamental risk control practice.

    Start with Low Leverage

    When you are new to trading, it is wise to use low leverage ratios or none at all. This allows you to gain experience with market movements without the amplified risk.

    As you become more comfortable and your strategies prove consistent, consider gradually increasing your leverage. Never use the maximum leverage offered by a broker simply because it is available.

    Actively Monitor Your Account

    Leveraged trading requires your attention. Keep a close watch on your open positions and your account equity. Your trading platform provides real-time data on your margin level. The margin level is calculated by dividing your account equity by your used margin, expressed as a percentage.

    A falling margin level is an early warning sign that your positions are moving against you. Active monitoring ensures you are always aware of your risk exposure, particularly during periods of high market volatility.

    Understand Your Total Exposure

    Leverage applies to each position you open. If you have multiple open positions, your total market exposure is the sum of all of them. Calculate your total exposure to ensure you are not over-leveraged across your entire portfolio.

    A common mistake for new traders is to open many small positions, not realizing their cumulative risk has become dangerously high. Prudent risk management involves seeing the complete picture of your market involvement.

  • What is a CFD and How Does it Work?

    What is a CFD and How Does it Work?

    In early 2020, global markets responded with unprecedented speed to international events. Seasoned investors watched indices like the Dow Jones Industrial Average fall thousands of points in a matter of days. Many saw their portfolios shrink. Yet, during this same period, a segment of traders found opportunities not in rising prices, but in falling ones.

    They did this without shorting stocks in the traditional sense, a complex process reserved for institutional players. Instead, they used a financial instrument designed for speculating on price movements in either direction. This instrument is a Contract for Difference, or CFD.

    It offers a distinct approach to the world’s financial markets. Understanding its function is the first step for anyone looking to engage with short-term market dynamics.

    What is a Contract for Difference?

    A Contract for Difference is a financial agreement between a trader and a broker. The two parties agree to exchange the difference in the value of a specific asset from the time the contract is opened to when it is closed. When you trade a CFD, you do not own the underlying asset. You are not buying a share of a company or a barrel of oil. You are simply speculating on the asset’s price direction.

    Think of it as a bet on price movement. If you believe the price of gold will rise, you open a ‘buy’ CFD position. If the price of gold does rise, you close your position for a profit based on the price change. If the price falls, you incur a loss. The core concept is that your profit or loss is determined by the accuracy of your prediction, multiplied by the size of your position.

    This separation from asset ownership is what makes CFD trading distinct from traditional investing.

    How CFD Trading Works

    The mechanics of a CFD trade involve a few key concepts: leverage, margin, and transaction costs. A clear understanding of this process is essential before placing any trade.

    Let’s walk through a hypothetical example. Suppose the current price of Company X stock is $100 per share. You believe the price will increase. You decide to open a CFD position to speculate on this movement.

    Leverage and Margin

    CFD trading utilises leverage, enabling you to control a large position with a relatively small amount of capital. Brokers express leverage as a ratio, such as 10:1 or 20:1. If the broker offers 10:1 leverage, it means you only need to put down 10% of the total trade value as a deposit. This deposit is called margin.

    In our example, you want to control a position equivalent to 100 shares of Company X.

    The total value of this position is 100 shares multiplied by $100 per share, which equals $10,000. With 10:1 leverage, your required margin would be 10% of $10,000, or $1,000. This $1,000 allows you to control a $10,000 position. Leverage magnifies your exposure to the market. This also means it magnifies both potential profits and potential losses.

    Going Long and Going Short

    With CFDs, you have two primary options.

    • Going Long: If you believe an asset’s price will rise, you open a ‘buy’ position. This is known as going long.
    • Going Short: If you believe an asset’s price will fall, you open a ‘sell’ position. This is known as going short.

    Since you predict Company X stock will rise, you would go long, opening a ‘buy’ position for 100 shares.

    Calculating Profit and Loss

    Your prediction proves correct. The price of Company X stock rises from $100 to $105 per share. You decide to close your position to secure the profit. The price difference is $5 per share. For your 100-share position, the total profit is $5 multiplied by 100, which equals $500.

    Now, consider the alternative. Your prediction is incorrect, and the stock price falls from $100 to $97. You decide to close the position to limit your losses. The price difference is $3 per share. Your total loss would be $3 multiplied by 100, which equals $300. These calculations do not include any associated costs.

    CFD Trading Costs

    There are two main costs to consider when trading CFDs.

    The Spread: The spread is the difference between the ‘buy’ price and the ‘sell’ price quoted by your broker. To open a ‘buy’ position, you trade at the higher price. To close it, you trade at the lower price. The position must cross this spread before it becomes profitable.

    Overnight Financing: If you keep a CFD position open overnight, you will typically incur a small fee. This fee, also known as a swap fee, reflects the cost of borrowing the capital to maintain the leveraged position. For positions on futures contracts, there are usually no overnight fees.

    Markets Available Through CFDs

    CFDs offer access to a wide range of global markets from a single platform. This is a significant feature for traders who want to diversify their activities without opening multiple accounts for different asset classes.

    ➖Indices

    You can trade CFDs on major stock market indices like the S&P 500, NASDAQ 100, and FTSE 100. This allows you to speculate on the overall health of an entire country’s stock market, not just a single company.

    ➖Forex

    The foreign exchange market is one of the most popular for CFD trading. You can trade major currency pairs like EUR/USD, GBP/USD, and USD/JPY, as well as minor and exotic pairs.

    ➖Commodities

    CFDs allow you to trade on the price movements of hard and soft commodities. This includes energy sources such as crude oil and natural gas, precious metals like gold and silver, and agricultural products like coffee and sugar.

    ➖Shares

    You can trade CFDs on thousands of individual company stocks from exchanges around the world, such as Apple, Tesla, and Amazon. This provides the opportunity to speculate on company performance without owning the shares.

    ➖Cryptocurrencies

    Many brokers now offer CFDs on popular cryptocurrencies like Bitcoin and Ethereum. This allows you to trade on their price volatility without needing a crypto wallet or dealing with a cryptocurrency exchange.

    ➖The Risks of CFD Trading

    While CFDs provide flexibility, they also carry significant risks. It is imperative that any potential trader fully understands these before committing capital. The use of leverage makes CFD trading a high-risk activity.

    ➖Market Risk

    The primary risk is that the market moves against your position. If you open a long position and the price of the asset falls, you will lose money. The more the market moves against you, the greater your loss will be. Rapid price fluctuations can result in substantial losses within a short period.

    Amplified Losses from Leverage

    Leverage is a double-edged sword. Just as it can magnify your profits, it can also magnify your losses. In the earlier example, a $1,000 margin controlled a $10,000 position. A small percentage drop in the asset’s value results in a large percentage loss relative to your margin.

    In some cases, losses can exceed your initial deposit, meaning you could owe the broker more money than you started with. Many regulated brokers offer negative balance protection to prevent this, but you must confirm this feature is in place.

    Gap Risk

    Markets can sometimes ‘gap,’ which means the price moves sharply from one level to another with no trading in between. This often happens overnight or during major news announcements.

    If a market gap happens against your position, your stop-loss order may not be executed at the desired price. It will be executed at the next available price, which could result in a much larger loss than you anticipated.

    Is CFD Trading Right for You?

    CFDs are complex instruments that carry a high risk of losing money rapidly due to leverage. They are not suitable for everyone. Generally, they are used by experienced traders who understand the risks involved. These traders often have a short-term view of the markets, looking to make trades over hours or days rather than holding investments for years.

    A person considering CFDs should have a high tolerance for risk. They must be prepared to lose their entire invested capital and potentially more. Active participation is also meaningful. Due to the fast-paced nature of leveraged trading, it is crucial to monitor your positions and the markets closely. CFDs are not a ‘set and forget’ instrument. 

    For those new to trading, starting with a demo account is a sensible way to practice and understand the mechanics without risking real money. Every trader should seek to make informed decisions based on thorough research and a solid trading plan.

  • Break the Cycle of Revenge Trading

    Break the Cycle of Revenge Trading

    You took a significant loss. The market moved against you with unexpected speed. Your stop loss triggered.

    A large portion of your account equity vanished in minutes. The initial shock gives way to a hot, rising anger. You feel an intense pressure to act. To get it back. To open another position, bigger this time, and force the market to give you back what it took.

    This impulse is revenge trading. It is a deeply human reaction to financial pain. It is also one of the fastest ways to destroy a trading account. Controlling this impulse is not a minor aspect of trading. It is the central challenge that separates consistent traders from the crowd.

    This article gives you a direct, actionable framework to stop revenge trading. It will help you protect your capital and build the emotional discipline required for long-term success.

    Understanding the Psychology of a Loss

    To defeat an enemy, you first need to understand it. Revenge trading is an emotional enemy. It operates on primal instincts, not logic. When you suffer a large financial loss, your brain does not react rationally. It perceives the loss as a threat, triggering a fight-or-flight response. Adrenaline floods your system. Your heart rate increases.

    Your ability to perform complex analysis evaporates. You are not thinking like a trader. You are thinking like a cornered animal.

    Several cognitive biases fuel this dangerous state. The first is loss aversion. Behavioral economists proved that the psychological pain of losing is twice as powerful as the pleasure of gaining an equal amount. Your brain screams that you must erase the pain of the loss immediately.

    The fastest way to do that seems to be winning it back on the next trade. This creates a powerful urge to jump back into the market without a plan.

    The sunk cost fallacy also plays a role. You have already invested time, emotional energy, and capital into a trade that failed. Instead of cutting your losses and moving on, you feel committed. The mind incorrectly reasons that since you have already lost so much, you must continue in order to recover your investment. This faulty logic pushes you to double down on a bad situation.

    Ego is the final ingredient. A loss feels personal. It feels like the market is telling you that you are wrong. For many, this is unacceptable. The need to prove their analysis was correct overrides all risk management rules. The trade stops being about probabilities and starts being about personal vindication. You are no longer trading the market. You are fighting it. This is a fight you will not win. Recognizing these psychological triggers is the first step toward disarming them.

    Your First Response to a Major Loss

    What you do in the first 60 minutes after a significant loss determines your fate. Your impulses will tell you to stay glued to the screen, to look for a new entry point, to fix the problem immediately. You must do the exact opposite. Your immediate goal is not to fix the trade. Your immediate goal is to regain control of your mind.

    The first and most important action is to walk away. Stand up from your desk. Close your trading platform. Leave the room where you trade. The physical act of moving creates a mental separation. Go outside. Get fresh air.

    Do something that forces your mind onto a different track. The charts will be there tomorrow. Your capital will not be if you act on impulse.

    Next, you must completely disconnect. Do not check prices on your phone. Do not read financial news. Do not open trading forums or social media groups. Every piece of market information you consume will fuel the emotional fire. You need a total circuit break from the market. This period of disconnection allows your nervous system to calm down.

    The adrenaline will subside. Your rational mind will begin to re-engage.

    During this time, acknowledge the emotion. Do not suppress it. Name it. Are you angry? Say, “I am angry about that loss.” Are you frustrated? Say, “I am frustrated that my plan failed.” Acknowledging the feeling reduces its control over you. When you try to ignore or fight an emotion, you give it more power. When you observe it and name it, you put yourself back in a position of control. You see it for what it is: a chemical reaction, not a command to act.

    Building a Long-Term Defense System

    Preventing revenge trading is not about willpower at the moment. It is about building systems that make it difficult to misbehave. Your success depends on the work you do before you ever place a trade. A professional trader operates within a rigid framework. This framework is their primary defense against emotional decisions.

    Your trading plan is this framework. It must be written down. It must be specific. Most importantly, it must contain non-negotiable rules for risk. Your plan should explicitly state your maximum loss per day, per week, and per month.

    For example, you might decide that if you lose 2% of your account capital in a single day, you are done trading. You will close all platforms and not open them again until the next session. This is not a suggestion. It is a hard rule. When you hit that limit, the decision is already made for you. There is no room for in-the-moment negotiation with your emotional brain.

    A trading journal is your second critical tool. A journal is not just a log of your entries and exits. It is a log of your mental state. For every trade, you should record why you took it, what you were thinking, and how you felt. When you take a loss, this practice is essential. Write down exactly what happened. Describe your emotional reaction. Did you feel the urge to revenge trade? What did it feel like? This process forces you to become an objective observer of your own behavior.

    Over time, you can review your journal to find patterns. You will see when you are most vulnerable. Perhaps it is after a string of small wins, which leads to overconfidence. Perhaps it is on a specific day of the week. Or with a particular asset. This data allows you to anticipate your weaknesses. You can then build specific rules to protect yourself. For instance, if you find you always get emotional trading a certain instrument, you either avoid it or trade it with a smaller position size. Your journal turns your emotional reactions into data you can analyze and act upon.

    Re-engaging the Market with Discipline

    After taking a large loss and following a cool-down period, you cannot simply return to trading as usual. Your confidence is fragile. Your primary goal now is not to make back the money you lost. Your goal is to execute a series of clean, disciplined trades according to your plan. Rebuilding your confidence is a process that requires patience and precision.

    Begin by reducing your position size. Cut it in half, or even to a quarter of your normal size. Trading with smaller size lowers the emotional stakes. It allows you to focus purely on your process without the intense pressure of significant financial outcomes.

    Your objective for the next ten trades is simply to follow your rules perfectly. A winning trade where you broke your rules is a failure. A losing trade where you followed every rule perfectly is a success. You are retraining your brain to associate good outcomes with good process, not with random profits.

    Next, you must conduct a detailed post-mortem of the original losing trade. Was the loss a result of a mistake? Did you enter too early? Did you fail to respect your stop loss? If so, identify the specific error. Write down a rule in your trading plan to prevent that error in the future. Or was the trade a valid setup that simply did not work?

    In trading, you can do everything right and still lose. Accepting this fact is a huge step in a trader’s development. It separates the process from the outcome. When you understand that losses are a normal cost of doing business, they lose their emotional power.

    Only after you have executed a series of well-managed trades with a smaller size should you consider gradually increasing your position size back to its normal level. This methodical approach proves to you that you are in control. It rebuilds confidence on a foundation of discipline, not on the hope of a single winning trade. It is a deliberate, professional approach to returning from a setback.

    Mastering your emotions is the final frontier in trading. The market will always provide opportunities. Your ability to capitalize on them over the long run depends entirely on your ability to remain objective and disciplined, especially in the face of a loss. Revenge trading is a symptom of a lack of structure.

    By building a robust trading plan, meticulously journaling your actions, and focusing on process over profits, you build a fortress of discipline. You replace impulsive, emotional reactions with a calm, methodical process. This is how you survive. This is how you grow as a trader.

    Ready to start?

  • Is Fear of Missing Out (FOMO) Silently Wrecking Your Account?

    Is Fear of Missing Out (FOMO) Silently Wrecking Your Account?

    Fear of missing out, or FOMO, is a powerful force. It drives you to make impulsive decisions. In trading, these decisions are almost always expensive. You see a chart moving higher. You hear chatter on social media about a stock taking off. An urgent feeling builds. You feel you must get in on the action now, before the opportunity is gone forever. So you jump in. You buy without a plan. You chase the price. This is not a strategy. It is gambling. 

    FOMO hijacks your rational mind and puts your emotions in control. The result is often the same: a damaged trading account and a lesson learned too late. Developing emotional control is the most critical skill for a trader. It separates consistent performers from the crowd. This is not about finding the perfect indicator. It is about mastering yourself.

    Understanding Trading FOMO

    FOMO in trading is the fear that others are profiting from a market move, and you are not. This anxiety compels you to enter a trade without proper analysis or a clear strategy. It is rooted in a basic human desire to be part of a winning group. Modern technology amplifies this feeling. 

    You have constant access to financial news, social media, and trading forums. Every moment, you see others posting about their gains. This creates a distorted view of reality. You only see the wins, not the many losses. You start to believe everyone is succeeding except you.

    Disciplined trading is different. A disciplined trader operates from a plan. Every action has a reason. Entry and exit points are defined before the trade is placed. Risk is calculated and managed. The disciplined trader accepts that missing an opportunity is part of the business. 

    Another one will always come along. The FOMO-driven trader, in contrast, acts on impulse. They see a fast-moving market as a personal threat. Their decisions are reactive, not proactive. They are not trading their strategy. They are trading their emotions. This path leads to consistent losses.

    Anatomy of a FOMO Trade

    Consider this common scenario. You start your trading day with a clear plan. You have identified potential setups based on your research. Suddenly, a stock not on your watchlist begins to surge. Your social media feed lights up. 

    People are posting screenshots of their profits. News headlines flash across your screen. The pressure builds. Your carefully prepared plan feels irrelevant. The only thing that matters is getting into this trade.

    You abandon your rules. You buy at a price far from any logical entry point. For a moment, you feel relief. You are in the trade. You are part of the action. The price might even move a little higher, giving you a brief sense of validation. Then, the market turns. The initial excitement evaporates. It is replaced by anxiety. The price drops further.

    Now, you are in a losing position with no plan. You did not set a stop-loss because you never expected the trade to fail. Panic sets in. Do you sell and take the loss? Do you hold on, hoping it will recover? Your mind races. 

    You are paralyzed by indecision. Often, you hold on too long, and a small loss becomes a significant one. This single trade, born from impulse, inflicts serious damage on your account balance. It also erodes your confidence, making it harder to trade effectively in the future.

    Identify Your Personal Triggers

    To conquer FOMO, you first must understand what triggers it in you. The triggers are different for everyone, but some are common. Watching a live chart of a volatile asset for too long induces anxiety. 

    Scrolling through social media and seeing others celebrate their wins is a powerful catalyst. Breaking news stories designed to create urgency can easily push you into a bad decision. Even conversations with other traders can plant the seed of FOMO if they focus only on big wins.

    The most effective tool to identify your triggers is a trading journal. A journal is more than a record of your trades. It is a record of your state of mind.

    For every trade you take, write down why you entered.

    • What were you feeling?
    • Were you calm and following your plan?
    • Or were you anxious and chasing the market?
    • Note the external factors.
    • Were you reacting to a news alert?
    • Did you see something on a forum? 

    Over time, patterns will emerge. You will see a clear link between certain situations and your impulsive trades. This self-awareness is the first step toward taking control. Once you know what causes the reaction, you can build a defense against it.

    Build Your Defense Against FOMO

    You defeat FOMO with discipline and structure. Your emotions are unreliable in a trading environment. Your system must be robust enough to protect you from yourself. This requires building and following a set of non-negotiable rules.

    First, you need a trading plan. A trading plan is your constitution. It governs every decision you make. It must be written down. It must be specific. Your plan should detail the exact criteria for entering a trade. It should define your exit strategy, including both your take-profit target and your stop-loss level. 

    Most importantly, it must include risk management rules. A common rule is to risk no more than 1% of your account on a single trade. When you have a complete plan, there are no gray areas. Either a setup meets your criteria, or it does not. If it does not, you do not trade. There is no room for emotion.

    Second, you must cultivate patience. The market is not going anywhere. It will be open tomorrow, next week, and next year. Opportunities are infinite.

    The belief that one trade is your only chance for success is an illusion created by FOMO. A professional trader thinks in terms of probabilities over a long series of trades. They know some trades will lose. They know they will miss some winners. It does not matter. What matters is sticking to their plan consistently.

    When you feel the urge to chase a trade, step away from your screen. Remind yourself that no single trade will make or break your career. Your discipline will.

    Third, you must control your information intake. Constant exposure to market noise is a direct cause of FOMO. You do not need to watch every tick of the price. You do not need to read every news article or social media post. This is just noise. It clouds your judgment. 

    Define specific times during the day to check the markets and read financial news. Outside of these times, close your charts. Turn off notifications. Unfollow accounts that promote hype and unrealistic returns. Your goal is to create a calm and focused trading environment, free from external pressures.

    The Joy of Missing Out

    The mindset of a successful trader is different. They do not fear missing out. They embrace it. They understand that missing a chaotic, unpredictable market move is a victory. It means they followed their plan. It means they protected their capital.

    This is the Joy of Missing Out, or JOMO. JOMO is a sign of emotional maturity. It is the quiet confidence that comes from knowing you are in control of your actions, regardless of what the market is doing.

    Every time you feel the pull of FOMO and choose not to act, you strengthen your discipline. You are not just avoiding a potential loss. You are building a habit of rational decision-making. Over time, this becomes your default state. Chasing trades will feel unnatural. Sticking to your plan will feel correct. 

    The peace of mind that comes from this approach is a significant reward. You will sleep better. You will approach each trading day with calm and clarity. Your focus will shift from short-term excitement to long-term consistency. This is the foundation of a sustainable trading career.

    Mastering your emotions is the ultimate challenge for a trader. The market is an arena of psychology. FOMO is one of the most destructive forces you will face. It preys on your insecurities and pushes you to self-destruct.

    But you have the ability to fight back. You do this with a concrete plan, unwavering patience, and strict control over your environment. 

    Stop letting fear dictate your decisions. Start building the discipline that leads to consistent performance. The first step is to write down your trading plan. Define your rules. Commit to following them. Your future self will thank you for it.

    Test Your Self Control

  • Finding Trading Opportunities in Developing Economies

    Finding Trading Opportunities in Developing Economies

    Investors often look toward emerging markets for growth. These are not frontier economies. They are not fully developed economies either. They are nations in a state of rapid economic transformation. Think of countries like Brazil, India, Mexico, and Indonesia.

    These nations show significant industrialization as they are integrating into the global financial system. Their defining feature is fast-paced growth that often outpaces established economies in North America or Western Europe.

    This progress is not a straight line. These economies possess specific characteristics. They typically feature a growing middle class. This population segment increases demand for goods and services. They also undertake continuous market reforms. Governments work to open their economies to foreign investment. They seek to create more stable financial systems

    This transition is complex. It presents a dual-sided scenario for traders. There is a potential for high rewards. There is also the presence of significant risk. A successful approach requires a deep understanding of the forces at play.

    You need to look beyond the headlines. You must analyze the fundamental economic drivers.

    The Allure of Growth

    The primary appeal of emerging markets is their growth potential. Several factors create this environment. These factors present unique opportunities for informed traders. Understanding them is the first step in building a sound strategy.

    First, consider interest rate differentials. Central banks in emerging economies often set higher interest rates compared to developed nations. They do this to combat inflation. They also do it to attract foreign investment. For forex traders, this creates a potential for carry trades.

    You borrow a currency with a low interest rate. You then buy a currency with a higher interest rate. The goal is to profit from the difference. This strategy depends on currency stability. Sharp devaluations wipe out gains from the interest rate spread.

    Second, demographics offer a compelling story. Many emerging nations have young, growing populations. This is the “demographic dividend.” A large, youthful workforce drives production and also forms a massive consumer base.

    This internal engine fuels economic expansion for years. It creates sustained demand for housing, transportation, and consumer goods. This contrasts sharply with aging populations in many developed countries. There, a shrinking workforce presents long-term economic challenges.

    Third, technology acts as an accelerator. Many emerging markets are leapfrogging older technologies. They adopt the latest innovations directly. Consumers in parts of Africa and Asia skipped landlines. They went straight to mobile phones. They skipped credit cards and went to digital payment systems. 

    This rapid adoption speeds up economic efficiency. It creates new industries. It also integrates millions of people into the formal economy for the first time. This technological jump shortens the development cycle. It creates investment opportunities in sectors like fintech and telecommunications.

    Navigating Inherent Risks

    The potential for growth in emerging markets comes with matching risks. These are not markets for the faint of heart. A clear-eyed assessment of the dangers is essential. Ignoring these factors exposes your capital to severe volatility.

    Political instability is a constant factor. Government policies change quickly. Elections produce unexpected outcomes. Social unrest creates economic paralysis. These events directly impact market sentiment and currency values. A new government might nationalize an industry. A trade dispute might erupt. These actions send shockwaves through the financial markets. Capital flees to perceived safe havens. This causes the local currency to weaken. Your strategy must account for this political risk.

    Currency volatility is another major concern. The currencies of emerging economies are often less liquid than major pairs like EUR/USD. They are also heavily influenced by commodity prices. Many emerging nations are major exporters of oil, copper, or agricultural products. A drop in the price of these commodities reduces export revenues. This puts downward pressure on the currency. These currencies are also sensitive to shifts in global investor sentiment. When global risk aversion rises, investors sell emerging market assets. This herd behavior leads to sharp, sudden devaluations.

    Debt is a third critical risk. Many emerging market governments and corporations borrow in foreign currencies, mainly the U.S. dollar. This creates a dangerous vulnerability. If the local currency weakens against the dollar, the real cost of servicing that debt increases. A country might earn its revenue in pesos or rand. It must repay its debt in dollars. A weaker local currency means more local currency is needed to buy the dollars for repayment. This situation can lead to a debt crisis. It is a risk that requires constant monitoring.

    Central Banks Dictate Flow

    Central banks are the most important actors in forex markets. Their decisions create trends that move currencies. This is especially true in emerging economies. Understanding their mandate and their actions is critical for fundamental analysis.

    Central banks in emerging markets have a dual mandate. They must control inflation. They must also maintain currency stability. These two goals are often in conflict. To fight inflation, a central bank raises interest rates. Higher rates make borrowing more expensive. This slows down the economy. Higher rates also attract foreign capital. This strengthens the currency. A stronger currency helps to lower the cost of imported goods, further reducing inflation.

    Conversely, if an economy is weak, the central bank might lower interest rates to encourage growth. Lower rates deter foreign investment. This can weaken the currency. A weaker currency makes exports cheaper and more competitive. It also makes imports more expensive, which can fuel inflation. The central bank must constantly balance these competing pressures. Their statements and actions provide clues to future policy.

    The actions of central banks in developed nations, especially the U.S. Federal Reserve, have a massive impact on emerging markets. When the Fed raises interest rates, it makes holding U.S. dollars more attractive. Capital flows out of riskier emerging markets and into the United States. 

    This “capital flight” weakens emerging market currencies. When the Fed lowers rates, the opposite happens. Investors seek higher yields elsewhere. Capital flows into emerging markets, strengthening their currencies. Your analysis of an emerging market currency is incomplete without a clear view of Fed policy.

    A Strategic Outlook

    Trading emerging market currencies requires a different approach than trading the majors. The markets are driven by different factors. The volatility is higher. The need for sound fundamental analysis is greater. You must connect the dots between economic data, central bank policy, and political events.

    Your strategy should begin with a top-down approach. First, assess the global macroeconomic environment. Is the U.S. Federal Reserve raising or lowering rates? Is global investor sentiment risk-on or risk-off?

    This global picture sets the stage. Second, analyze the specific country. What is its political situation? What is its debt level? What are its key exports, and what are the price trends for those commodities?

    Finally, look at the actions of the local central bank. Is it fighting inflation or promoting growth? Its policy decisions will be a primary driver of the currency’s value. By building this complete picture, you move beyond simple chart patterns. You trade based on the fundamental economic realities of a nation.

    This analytical depth is what separates a speculative bet from a well-reasoned trade. It requires patience. It requires discipline. The opportunities in emerging markets are real. The risks are just as real. Success depends on your ability to see both sides clearly.

  • Signal vs. Noise: Which Economic Indicator Matters Most?

    Signal vs. Noise: Which Economic Indicator Matters Most?

    Traders constantly ask one question. Which economic indicator gives the most reliable signal? They want a single, definitive metric. A number that points to clear profit or loss. This search is understandable. The financial markets are a storm of data. A single lighthouse would make navigating them simpler.

    The truth is more complex. No single indicator is a magic bullet. A solitary data point is just noise. Its value becomes apparent when placed in context. Reliability does not come from one indicator. It comes from the convergence of several. It’s about connecting the dots between economic performance, inflation, and policy. 

    This is how you build a high-level fundamental analysis. This is how you move from reacting to headlines to anticipating market movements. This article provides a framework for that process. It examines the major indicators. It shows how they fit together to create a clearer picture of the market.

    Gross Domestic Product: The Economic Report Card

    Gross Domestic Product (GDP) is the broadest measure of a country’s economic health. It represents the total market value of all final goods and services produced in a specific time period. Think of it as the economy’s annual performance review. A rising GDP suggests a growing, healthy economy. A falling GDP signals contraction.

    For currency traders, GDP is a foundational piece of information. A strong GDP report typically strengthens a nation’s currency. It signals a robust economy that attracts investment. Foreign capital flows into a country with strong growth prospects. This increases demand for its currency. For example, if the United States reports a higher than expected GDP growth, demand for the U.S. dollar often rises. The USD strengthens against other currencies like the euro or the yen.

    GDP’s strength is also its weakness. It is a lagging indicator. The data reflects the past quarter or year. By the time the official numbers are public, the market conditions may have already shifted. Professional traders often have a good idea of the GDP numbers before the release. They follow more frequent data points to build their forecast. 

    Therefore, the biggest market reaction often occurs when the released number is a surprise. If analysts expected 2% growth and the report shows 3%, the market will react sharply. If the number meets expectations, the reaction is often muted. The information was already priced in. You should view GDP as the foundation of your analysis. It sets the long-term context. It confirms the trend. You then use more timely indicators to understand what is happening right now.

    Inflation Gauges: Reading the Price Temperature

    Inflation is a critical force in the forex market. It measures the rate at which the general level of prices for goods and services is rising. It also reflects a fall in the purchasing power of a currency. Two key reports tell you what you need to know about inflation: the Consumer Price Index (CPI) and the Producer Price Index (PPI).

    CPI measures the average change in prices paid by urban consumers for a basket of consumer goods and services. It is the most widely used measure of inflation. PPI tracks the average change in selling prices received by domestic producers for their output. It is often seen as a leading indicator for CPI. If producers are paying more for materials, they will likely pass those costs on to consumers.

    Central banks watch inflation closely. Most have a target inflation rate, typically around 2%. If inflation moves too far from this target, they will act. This is where the trading signal emerges. Persistently high inflation prompts a central bank to increase interest rates. Higher rates make a currency more attractive to foreign investors seeking higher returns on their capital. This inflow of capital increases demand for the currency, causing it to appreciate. 

    For instance, if the Eurozone’s CPI consistently comes in above the European Central Bank’s target, traders will anticipate that the ECB will tighten its monetary policy. This anticipation alone can strengthen the euro. You must watch inflation data not just for the numbers themselves. You watch it to predict the actions of central banks.

    Central Banks and Interest Rates: The Market’s Conductor

    If economic indicators are the orchestra, the central bank is the conductor. While GDP and inflation are vital, the decisions made by central banks are the most direct drivers of currency value. Institutions like the U.S. Federal Reserve, the European Central Bank, and the Bank of England hold immense power. Their primary tool is the overnight interest rate. This is the rate at which banks lend to each other. It influences all other interest rates in the economy.

    The logic is straightforward. When a central bank raises its benchmark interest rate, holding assets in that country’s currency becomes more profitable. Global investment funds will shift capital to take advantage of the higher yield.

    This movement of money, known as “hot money,” increases demand for the currency and pushes its value up. Conversely, when a central bank cuts rates, the currency becomes less attractive. Capital flows out, and the currency weakens.

    The actual rate decision is only part of the story. Forward guidance is just as important. This refers to the statements, press conferences, and meeting minutes released by central banks. In these communications, they signal their future intentions. A central banker might hint that rate hikes are coming if inflation does not cool down. Or they might suggest that the economy is too weak to withstand higher rates. 

    Traders scrutinize every word. They are looking for clues about the path of monetary policy. A change in tone from hawkish (favoring higher rates) to dovish (favoring lower rates) can move the market as much as an actual rate change. Your job is to listen to what central banks are saying. They use data like GDP and CPI to make their decisions. Their actions and words are the most direct signal for traders.

    Employment Data: A Real-Time Economic Pulse

    While GDP is quarterly, employment data is typically released monthly. This frequency gives it immense importance. It offers a more current snapshot of the economy’s health.

    The most watched employment report in the world is the U.S. Non-Farm Payrolls (NFP) report. It is released on the first Friday of every month and is a major market-moving event.

    The NFP report provides three key pieces of data. The first is the number of new jobs created in the non-agricultural sector. The second is the unemployment rate. The third is average hourly earnings, which is a measure of wage inflation. Together, these numbers paint a detailed picture of the labor market.

    A strong NFP report shows that businesses are hiring. This signals a healthy, expanding economy. More people working means more consumer spending, which fuels economic growth. A strong report also suggests potential wage inflation, which can contribute to overall inflation.

    This combination puts pressure on the central bank to consider raising interest rates. As a result, a positive NFP surprise will almost always strengthen the U.S. dollar. 

    A weak report has the opposite effect. It signals economic trouble and reduces the likelihood of rate hikes, weakening the dollar. Because of its timeliness and its direct link to consumer spending and inflation, the NFP report is one of the most powerful short-term indicators for forex traders. It provides a monthly check-up on the health of the world’s largest economy.

    Consumer Health: Confidence and Spending

    Economic activity is ultimately driven by people. If consumers are confident about the future, they spend money. If they are worried, they save. That is why measures of consumer health are valuable leading indicators. They offer a glimpse into future economic trends. Two such indicators are the Consumer Confidence Index (CCI) and Retail Sales reports.

    The CCI is a survey that measures how optimistic consumers are about their financial situation and the overall economy. A high level of confidence suggests that people are more likely to make large purchases in the coming months. This could be a new car, a home, or a vacation.

    This spending drives economic growth. The Retail Sales report provides a more direct measure of that spending. It tracks the total value of sales at retail stores. It is a direct indicator of consumer demand.

    For traders, these indicators provide a look into the future. A strong and rising consumer confidence report, followed by a solid retail sales number, suggests that economic growth will continue. This reinforces the case for a strong currency. It confirms that the economic fundamentals are sound. However, these indicators also have limitations. Confidence is a feeling. It does not always translate into actual spending. 

    A person might report feeling confident but still choose to save their money because of specific personal concerns. For this reason, you should use consumer data in conjunction with other indicators. When confident consumers are actually spending, as confirmed by retail sales, the signal is much stronger.

    Building a Coherent Framework

    No single indicator provides a perfect signal. The key is to synthesize the information from all of them. You need a framework that connects long-term trends with short-term data. This allows you to build a trading thesis based on a convergence of evidence.

    Start with the big picture. Use annual and quarterly GDP data to establish the long-term economic trend of a country. Is the economy in a solid expansion, or is it struggling? This is your baseline.

    Next, focus on inflation. Watch the monthly CPI reports. Is inflation heating up and moving away from the central bank’s target? High inflation in a growing economy is a strong signal for future interest rate hikes.

    Then, turn all your attention to the central bank. Read their statements. Listen to their press conferences. Are they sounding hawkish or dovish? Their language will tell you how they are interpreting the GDP and CPI data. Their forward guidance is your most important clue.

    Finally, use the high-frequency monthly data to test your thesis. Watch the NFP, retail sales, and consumer confidence reports. Do these numbers confirm the broader economic story? For example, if your thesis is that the U.S. economy is strong and the Fed will raise rates, you expect to see strong NFP and retail sales numbers.

    If you get them, your thesis is confirmed. If the numbers are weak, you must question your thesis. The market is telling you something has changed.

    This process transforms you from a reactive trader into a proactive one. You are not just following one number. You are understanding the entire economic story. When multiple indicators all point in the same direction, you have found a reliable signal. It is not a guarantee. It is a high-probability opportunity based on a deep understanding of fundamental forces.