The effectiveness of Fibonacci analysis is directly tied to the use of multiple timeframes. Markets are fractal, meaning that price patterns, such as trends and corrections, appear on all chart durations, from one minute to one month.
However, there is a clear hierarchy of influence: a trend on a higher timeframe (HTF), such as the weekly or daily chart, will almost always overpower a conflicting trend on a lower timeframe (LTF), like the 15-minute chart. A professional trader aligns their analysis from the top down, ensuring a short-term entry is supported by the dominant, long-term market structure.
The Principle of Top-Down Analysis
Top-down analysis is a systematic process of evaluating the market across progressively shorter timeframes. This method filters out low-probability trades and aligns the trader with the market’s primary momentum. The typical sequence involves three stages:
Strategic Analysis (Weekly/Daily Charts): Identifies the dominant, long-term trend and major support/resistance zones.
Tactical Analysis (4-Hour/1-Hour Charts): Narrows focus to find high-probability entry areas within the context of the long-term trend.
Execution Analysis (15-Minute/5-Minute Charts): Pinpoints the precise entry trigger to maximise risk-to-reward.
Attempting to trade a lower-timeframe signal that contradicts the higher-timeframe trend is a common and costly error. For instance, buying a dip on a 15-minute uptrend is a low-probability trade if the daily chart shows the price is hitting a significant resistance level within a dominant downtrend.
Stage 1: Strategic Analysis on Higher Timeframes (HTF)
The analysis must begin on the weekly and daily charts to establish the primary market bias.
Weekly Chart
Objective: To identify the long-term, structural trend. Is the market in a clear uptrend (higher highs and higher lows) or a downtrend (lower highs and lower lows) over the past several months or years?
Fibonacci Application: Apply the Fibonacci retracement tool to the most significant and most extensive swing points on this chart. A pullback to a weekly 38.2% or 61.8% retracement level is an important event that attracts institutional capital. These HTF Fibonacci levels form the foundation of any trade plan.
Daily Chart
Objective: To analyse the intermediate trend within the context of the weekly structure.
Fibonacci Application: Plot Fibonacci retracements on the more recent, prominent swings of the daily chart. The goal is to find confluence, where a daily Fibonacci level aligns with a pre-identified weekly level. For example, if a weekly 38.2% support level at $500 also corresponds to a 61.8% retracement of the most recent daily up-move, that $500 zone becomes a high-conviction area for potential buying interest.
Stage 2: Tactical Analysis on Intermediate Timeframes
Once a high-probability zone is identified on the HTF charts, the analyst moves to the 4-hour and 1-hour charts to refine the entry strategy.
Objective: To observe the market’s reaction as it enters the HTF zone of interest and to find more precise levels for a potential entry.
Fibonacci Application
Counter-Trend Analysis: If the price is falling toward a central HTF support zone, a Fibonacci extension tool can be applied to the most recent LTF down-swing. If a 127.2% or 161.8% extension of this down-swing projects a target that terminates inside the HTF support zone, it suggests that short-term selling momentum may become exhausted at that point.
Confirmation Signals: The trader is not looking to change their directional bias based on these timeframes. Instead, they are looking for signs that the HTF level is holding, such as a break of a minor trendline on the 1-hour chart.
Stage 3: Execution on Lower Timeframes (LTF)
The final step is to use the 15-minute or 5-minute charts to time the entry with maximum precision. This stage is initiated only after the HTF and intermediate timeframe analyses are complete and aligned.
Objective: To identify a specific, low-risk entry trigger.
Fibonacci Application: While less common for direct signals, Fibonacci can be used here to analyse the first small impulse move off the significant HTF support. A trader might wait for the first 5-minute impulse wave up, then enter on a 50% or 61.8% retracement of that minimal move.
Primary Triggers: More commonly, the execution is based on classic price action signals that occur within the HTF zone:
A clear reversal candlestick pattern (e.g., bullish engulfing, hammer).
The formation of the first higher high and higher low on the 15-minute chart signals a structural shift from bearish to bullish at the micro-level.
By following this multi-timeframe protocol, a trader ensures they are acting in harmony with the market’s dominant forces. The Fibonacci levels drawn on the weekly chart provide the “where,” and the price action observed on the 15-minute chart provides the “when.” This combination of strategic patience and tactical precision is a hallmark of professional trading.
The debate over the effectiveness of Fibonacci ratios is as old as technical analysis itself. Proponents see it as a map to the market’s hidden structure, while critics dismiss it as financial astrology, arguing that its perceived success is merely a product of confirmation bias. The only way to move beyond opinion and into the realm of fact is through rigorous, objective testing.
Backtesting is the process of applying a specific set of trading rules to historical market data to determine if that strategy would have been profitable in the past. For a tool as subjective as Fibonacci, this process is challenging, but it is the only way to answer the critical question: Does this strategy actually have a statistical edge?
The Challenge: Overcoming Subjectivity
Unlike an indicator like a moving average crossover, which generates a clear, objective signal that can be easily automated, Fibonacci analysis is inherently discretionary. The selection of swing high and swing low points is open to interpretation, meaning that two traders can examine the same chart and draw different levels.
This subjectivity makes automated backtesting nearly impossible for most platforms. Therefore, a manual backtest is required, which demands a strict, predefined framework to remove discretion from the process.
A Step-by-Step Guide to Manual Backtesting
A successful backtest relies on creating a trading plan with rules that are so clear and mechanical that there is no room for interpretation during the test.
Step 1: Define an Objective Trading Strategy
First, create a concrete set of rules for entry, exit, and risk management. Ambiguity is the enemy of a valid test. A well-defined strategy might look like this:
Asset and Timeframe: EUR/USD, using the Daily chart for trend and the 4-Hour chart for signals.
Trend Filter: The 50-period EMA must be above the 200-period EMA on the Daily chart to confirm an uptrend. Only long trades will be considered.
Swing Point Definition: An impulse wave is defined as a move of at least 300 pips from a swing low to a swing high. A swing low is the lowest point of three candles, with a higher low on either side.
Entry Signal: Enter a long position if the price retraces and touches the zone between the 50% and 61.8% Fibonacci levels. The entry is only valid if a bullish engulfing candle forms within this zone on the 4-Hour chart.
Stop-Loss: Place the stop-loss 10 pips below the low of the swing that ended the retracement (Point C).
Profit Target: The first profit target is the prior swing high (Point B). The second target is the 127.2% Fibonacci extension.
Step 2: Select the Historical Data
Choose a specific market and a significant period of historical data. The data should encompass a range of market conditions, including strong trends, bear markets, and sideways ranges. A period of at least five years is recommended to ensure the strategy is robust.
Step 3: Simulate and Record Trades
Using a charting platform with historical data, go back to the beginning of your selected period. Advance the chart bar by bar, as if it were happening in real-time. Do not look ahead. When your exact set of rules from Step 1 is met, document the trade in a spreadsheet with the following columns:
Trade Number
Date of Entry
Entry Price
Stop-Loss Price
Profit Target Price(s)
Risk in Pips (Entry Price – Stop-Loss Price)
Reward in Pips (Profit Target – Entry Price)
Risk-to-Reward Ratio
Outcome (Win/Loss)
Profit/Loss in Pips
Repeat this process until a statistically significant number of trades is recorded, ideally 100 or more.
Step 4: Analyse the Performance Metrics
Once the data is collected, analyse the results to gauge the strategy’s viability.
Win Rate: The percentage of trades that were profitable.
Average Risk-to-Reward Ratio (RRR): A high win rate is not required if the RRR is strong. For example, a strategy with a 40% win rate can be highly profitable if the average winner is three times larger than the average loser (1:3 RRR).
Profit Factor: Calculated as Gross Profit / Gross Loss. A value above 1 indicates profitability. A value above 1.5 is generally considered good.
Maximum Drawdown: The most considerable percentage loss from a peak equity value to a subsequent trough. This measures the potential pain of a losing streak and is a critical metric for risk management.
Expectancy: This calculates the average amount a trader can expect to win or lose per trade.
Expectancy = (Win Rate x Average Win Size) – (Loss Rate x Average Loss Size)
A positive expectancy means the strategy has a statistical edge.
Interpreting the Results and Moving Forward
The goal of backtesting is not to prove that Fibonacci works universally, but to determine whether your specific, rule-based strategy is effective on a particular market and timeframe. Some studies have shown that basic Fibonacci strategies perform no better than a coin flip, with success rates of less than 50%. However, a well-defined plan that incorporates convergence factors, such as moving averages or momentum oscillators, can produce a positive expectancy.
If the backtest yields positive results, the final step before risking real capital is forward testing, also known as paper trading. This involves applying the strategy in a live market simulation for several weeks or months.
Forward testing confirms that the strategy performs effectively in current market conditions and, just as importantly, that the trader possesses the necessary psychological discipline to execute the plan without deviation. Backtesting turns a subjective tool into a data-driven system, replacing hope with probability.
The trader sat staring at the screen, a familiar tension gripping his shoulders. The entry was perfect. He had waited patiently for days as the tech stock, a market leader, pulled back from its recent highs. He identified the 50% retracement level, saw it converge with the 100-day moving average, and waited for a bullish reversal candle to confirm his thesis. It printed beautifully, a textbook hammer candle.
He entered the trade, placing his stop-loss below the 61.8% level. Now, the position was well in profit. The stock had rallied back and was approaching its previous high.
And the real battle began. A voice of fear whispered, “Sell now. Take the profit before it vanishes.” A louder, greedier voice roared, “Hold on. This is going to the moon.”
This internal conflict is the enemy of profitability. An entry strategy gets a trader into the game, but an exit strategy is what pays the bills. Without a logical, predetermined plan for taking profits, a trader is at the mercy of their own conflicting emotions. They will sell too early and miss the heart of a move, or they will hold too long and watch a winning position turn into a losing one.
This is where the Fibonacci sequence reveals its second, and arguably more powerful, function. While retracements help identify where a pullback might end, Fibonacci extensions project where the next impulse wave might travel. They provide a data-driven roadmap for setting profit targets, transforming the emotional act of selling into a strategic execution.
The Journey Forward: From Retracement to Fibonacci Extensions.
A retracement is a look backward. It measures how much of a prior move has been given back. An extension is a look forward. It projects potential price targets in the direction of the primary trend. It answers the crucial question every trader faces after a successful entry: “How far can this go?”
The application is different from the retracement tool. A retracement is a two-point tool, drawn from the beginning of a move to its end. An extension is a three-point tool, requiring the identification of three distinct price points:
Point A: The start of the primary impulse wave. For an uptrend, this is the significant swing low.
Point B: The end of the primary impulse wave. This is the swing high.
Point C: The end of the corrective retracement. This is the swing low of the pullback, the very point where the savvy trader entered their position.
Once the trader plots these three points, the software projects a series of new lines onto the chart. These are the extension levels. They are not contained within the initial move. They are projected out into the open space on the right side of the chart, providing objective, mathematically derived targets for the next wave higher.
Reading the Roadmap: The Key Extension Levels
Just as with retracements, a few key extension levels command the most attention from institutional and retail traders alike. Each one tells a different story about the potential strength of the trend.
The 100% Extension: This level is often referred to as the “measured move” or “symmetrical move.” It signifies a state of market balance and rhythm. When the price reaches the 100% extension, the second impulse wave (the move from Point C to the target) is exactly equal in length to the first impulse wave (the move from Point A to Point B).
Many technical traders see this symmetry as a logical completion point for a standard trend wave. It is a common area for significant profit-taking, and a trader might choose to sell a portion of their position here. It is the target for a healthy, well-behaved trend.
The 161.8% Extension: This is the golden ratio applied to profit targets. When a market is in a powerful, high-momentum trend, it will often slice right through the 100% extension level. The next major stop for many institutional algorithms and professional traders is the 161.8% level. Reaching this target signifies exceptional strength. The second impulse wave is significantly longer than the first.
It is a sign that the dominant force (buyers in an uptrend) is in complete control. For the trader who entered at Point C, seeing the price reach this level is the “home run.” It is the reward for correctly identifying a powerful trend and having the discipline to hold the position through minor counter-moves.
The 261.8% and 423.6% Extensions: These higher-level extensions are rarer. They typically only come into play during periods of extreme market speculation or panic. A stock that reaches its 261.8% extension is in a state of parabolic ascent. The mood is euphoric. Financial news channels are buzzing.
This is the point where a professional trader’s internal alarms start ringing loudly. While amateurs are piling in, blinded by greed, the professional sees this as a sign of a blow-off top. They are not setting targets here; they are aggressively taking their final profits and looking for exit signals. These are not levels of opportunity; they are levels of extreme risk.
A Tale of Two Traders
Let’s return to our trader and his tech stock. He is faced with the decision to sell or hold. Let’s imagine two versions of him.
Trader A, ruled by emotion, succumbs to fear. As the stock tickles its previous high, he sells his entire position. He books a respectable 1:2 risk-reward profit. He feels a moment of relief, followed by days of agony as he watches the stock rocket higher, ultimately hitting the 161.8% extension level. His fear cost him the majority of the move.
Trader B, the consummate professional, acts on his plan. He had already plotted the Fibonacci extension levels from the moment he entered the trade.
His Plan: Sell 50% of the position at the 100% extension level. Move the stop-loss on the remaining 50% to his original entry price, making the rest of the trade “risk-free.” His final target for the second half is the 161.8% extension level.
The Execution: The stock hits the previous high and keeps going. As it approaches the 100% extension, his pre-placed sell order is triggered. He has now locked in a profit, and the trade can no longer lose money. The fear is gone, replaced by the calm of a well-executed plan. The stock continues its powerful rally. A week later, it hits the 161.8% level. His second sell order is filled. He has captured the heart of a massive move, maximizing his gain while systematically managing his risk.
Trader B did not predict the future. He simply used an objective tool to create a logical plan and had the discipline to follow it. He let the mathematics of the market, not the turmoil of his emotions, dictate his exits. That is the fundamental difference between a hobbyist and a professional.
Winning in financial markets is not a function of predicting the future. It is a game of probabilities and discipline. The most successful traders are obsessive with capital preservation. This is the domain of risk management, the least glamorous but most critical aspect of trading.
A tool like Fibonacci is often viewed as a way to find entries. Its true professional application, however, is as a sophisticated framework for defining risk, managing position size, and ensuring that one bad trade never destroys a trading account.
Defining the Trade Before It Happens
The amateur trader chases prices. They see a market moving and jump in, driven by the fear of missing out. The entry is impulsive, the stop-loss is an afterthought, and the profit target is a vague hope. The professional trader does the opposite. Before a single dollar is risked, the entire trade is planned.
The exact entry point, the precise exit point for a loss, and the target for a profit are all clearly defined. Fibonacci retracement levels provide the structure for this plan.
Consider a stock in a strong uptrend that has just pulled back. A trader identifies a confluence zone where the 50% retracement level meets a previous support area. This confluence zone becomes the proposed entry point. The plan is now in motion:
Entry: A buy order is placed at this specific zone, but only upon seeing a confirmation candle.
Stop-Loss: A stop-loss order is placed below a logical invalidation point, such as the 61.8% level or the swing low that started the up-move.
Profit Target: A profit target is set at the previous swing high or a predetermined Fibonacci extension level.
With these three points defined, the trade is no longer a gamble. It is a calculated business decision with a known risk and a potential reward. The trader is not hoping for a good outcome; they have a plan for both a good outcome and a bad one.
The Stop-Loss: A Strategic Invalidation Point
The stop-loss is the most important order a trader will ever use. It is a pre-set order that automatically closes a losing position at a specific price. Its purpose is to cap the potential loss. Fibonacci levels help a trader place a stop-loss based on logic, not on an arbitrary dollar amount or percentage.
The stop-loss should be placed at a point where the original trade idea is proven wrong.
Logic in an Uptrend: If a trader buys a stock at the 50% retracement level, they are operating under the assumption that the uptrend is still intact and the pullback is temporary. If the price continues to fall and breaks decisively below the 61.8% level, the probability that the trend has changed increases significantly.
A stop-loss placed just below the 61.8% level or, for a more conservative approach, below the entire swing low, acts as a circuit breaker. The trade is closed not because the loss hit a pain threshold, but because the technical reason for being in the trade is no longer valid.
Logic in a Downtrend: The inverse is true for a short position. A trader sells at a 38.2% rally, expecting the downtrend to resume. If the price continues to rally and breaks above the 50% or 61.8% level, the trade premise is invalidated. The stop-loss, placed just above the 61.8% level, exits the trade based on the market’s new information.
Position Sizing Based on Fibonacci Zones
Once the stop-loss level is determined, the next critical step is position sizing. This is what separates traders who survive from those who blow up their accounts.
The rule is simple: risk a small, fixed percentage of the total account equity on any single trade, typically 1% to 2%. The distance between the entry point and the stop-loss determines how many shares or contracts can be purchased.
Scenario A: Tight Stop. A trader decides to buy at the 50% retracement level and places a tight stop-loss just below the low of the confirmation candle. The distance in points is small. This allows for a larger position size while keeping the dollar risk at the desired 1% of the account.
Scenario B: Wide Stop. Another trader, more conservative, buys at the same 50% level but places their stop-loss below the entire swing low that preceded the move. The distance in points is much larger. To maintain the same 1% dollar risk, this trader must take a significantly smaller position size.
The choice is a trade-off. The tight stop offers a better risk-to-reward ratio but is more likely to be triggered by random market noise. The wide stop gives the trade more room to breathe but requires a smaller position and results in a lower risk-to-reward ratio. There is no single correct answer, but Fibonacci provides the clear price levels needed to make this strategic decision.
Calculating the Risk-to-Reward Ratio
Profitability is a mathematical equation. It is a function of win rate and the risk-to-reward ratio. The risk-to-reward ratio compares the amount of money risked on a trade to the potential profit. A ratio of 1:2 means that for every $1 risked, the trader stands to make $2.
Professionals almost exclusively seek trades with a ratio of at least 1:2 or higher. This is because it provides a significant mathematical edge. With a 1:2 ratio, a trader can be wrong more than half the time and still be profitable.
Fibonacci levels provide the key inputs for this calculation.
Risk: The distance from the entry price to the stop-loss price.
Reward: The distance from the entry price to the profit target, which is often the previous swing high or a Fibonacci extension level.
If a trader buys at a 50% retracement of 100 points and places a stop-loss 25 points away, the risk is 25 points. If the target is the old high, which is 50 points away, the risk-to-reward ratio is 1:2. This is a trade worth considering. If the target were only 30 points away, the ratio would be close to 1:1. Most professionals would pass on such a trade, as it offers no significant edge.
Advanced Tactics: Scaling In and Out
Risk management is not always a simple in-or-out proposition. Advanced traders use Fibonacci levels to manage risk dynamically by scaling their positions.
Scaling In: Instead of entering a full position at a single level, a trader might build a position. They could buy 25% of their intended size at the 38.2% retracement, 50% at the 50% level, and the final 25% at the 61.8% level.
This provides a better average entry price if the market pulls back deeply. The single stop-loss for the entire composite position remains at the invalidation point below the swing low.
Scaling Out: This is a method for managing profits and reducing risk as a trade moves in the trader’s favor. Once the price moves up and reaches the previous swing high, the trader might sell half of their position.
This books a profit and covers the initial risk. The stop-loss on the remaining half is then moved up to the original entry price. The trade is now a “risk-free” trade. The remaining position is left to run toward higher Fibonacci extension targets, allowing the trader to profit from a strong trend continuation while having already secured a gain.
This disciplined, mathematical approach to risk is the bedrock of a professional trading career. Fibonacci levels are not a crystal ball. They are a logical map that helps a trader define risk, control losses, and systematically extract profits from the market. The bottom line is protected not by being right, but by being prepared to be wrong.
In the world of technical analysis, there is no magic bullet. No single indicator can reliably predict market turns or guarantee profitable trades. The markets are too complex, driven by too many variables.
Professional traders understand this. They do not search for a single, perfect tool. Instead, they operate like detectives building a case. They gather multiple, independent pieces of evidence.
When several distinct clues all point to the same conclusion, the case becomes strong. In trading, this principle is called confluence. It is the practice of identifying price zones where different analytical tools align, creating a high-probability setup. For a Fibonacci trader, mastering confluence is the transition from amateur speculation to professional execution.
Beyond the Lines: The Fallacy of Isolation
A common mistake among novice traders is to treat Fibonacci levels as infallible signals. They see the price approaching a 61.8% retracement level and immediately place a trade. This is a one-dimensional approach that ignores the broader market context. A Fibonacci level in isolation is just a line on a chart. It is a point of potential, not a point of certainty. The price can, and often does, move right through it.
The power of a Fibonacci level increases exponentially when it intersects with other technical signals. This intersection creates a “confluence zone” or a “hot spot” on the chart. It is an area where the probability of a market reaction is significantly higher.
The logic is straightforward: if one group of traders is watching a moving average, another is watching a support level, and a third is watching a Fibonacci retracement, a price point where all three converge becomes a focus of immense attention.
The orders placed by these different groups stack up, creating a formidable barrier of support or resistance. A trader who identifies this zone is positioning themselves alongside a powerful coalition of market participants.
Confluence in Action: Fibonacci and Horizontal Support/Resistance
The most basic and powerful form of confluence is the combination of Fibonacci levels with classic horizontal support and resistance. These horizontal levels are created by previous swing highs and swing lows.
They mark price points where the market has reversed direction in the past. The market has memory. A price level that acted as strong resistance in the past will often become strong support once it is broken.
Consider this scenario:
An asset is in a clear uptrend. It rallies strongly, creating a new high.
The price then pulls back. A trader draws a Fibonacci retracement tool from the start of the rally (the swing low) to its peak (the swing high).
The trader notices that the 50% retracement level aligns almost perfectly with a previous resistance level that the market struggled to break a few weeks prior.
This is a powerful confluence zone. The previous resistance is now expected to act as support (a principle known as “polarity”). At the same time, the 50% retracement level is a natural point for a pullback to pause. The alignment of these two independent factors creates a high-probability buy zone.
A reversal candle forming in this specific area provides the final piece of evidence, signaling that both the support-and-resistance traders and the Fibonacci traders are actively buying.
Weaving in Moving Averages
Moving averages are another core tool for trend-following traders. They smooth out price action and help define the direction and strength of a trend. Dynamic and widely watched moving averages, like the 50-period, 100-period, and 200-period, often act as dynamic support in an uptrend and dynamic resistance in a downtrend. Combining these with static Fibonacci levels can yield exceptional trading opportunities.
Imagine a currency pair in a sustained uptrend.
The price remains consistently above its 200-period moving average, confirming the long-term bullish bias.
The market completes a strong impulse move higher and begins to correct.
As the price pulls back, it approaches the 200-period moving average. At the same time, it is also approaching the 61.8% Fibonacci retracement level of the last impulse wave.
The moving average and the Fibonacci level converge at almost the exact same price.
This creates a zone of intense interest. The long-term trend followers who use the 200-period moving average as their primary guide see a buying opportunity. The Fibonacci traders see their “golden ratio” support level coming into play.
The combined buying pressure from these two large groups creates a formidable floor under the price. A trade entered in this zone has a much higher statistical chance of success than a trade based on either indicator alone.
Oscillators: Gauging Momentum at Key Levels
Oscillators are indicators that help traders gauge momentum. They move back and forth between two extremes, typically indicating “overbought” or “oversold” conditions. Common examples include the Relative Strength Index (RSI) and the Stochastic Oscillator.
While these tools can give false signals in strongly trending markets, they become incredibly valuable when combined with Fibonacci levels. The goal is not just to see an oversold reading, but to see an oversold reading at a key location on the chart.
A professional analyst looks for this sequence:
Identify a Trend: The market is in a confirmed uptrend.
Draw Fibonacci: A significant impulse wave occurs, and the Fibonacci retracement tool is applied.
Watch the Pullback: The price begins to retrace toward a key Fibonacci level, for instance, the 50% line.
Check the Oscillator: As the price nears the 50% level, the trader checks the RSI. The RSI drops below 30, signaling an oversold condition.
Look for Divergence: Even more powerful is a bullish divergence. This occurs when the price makes a new low during the pullback, but the RSI makes a higher low. This indicates that the downward momentum is fading, even as the price is still falling. A bullish divergence occurring right at a major Fibonacci support level is one of the most reliable reversal signals in technical analysis.
This combination provides a complete picture. The Fibonacci level identifies the where. The oversold condition or divergence from the oscillator identifies the when. It signals that the selling pressure is likely exhausted at a location where buyers were already expected to appear.
Building a Case for a Trade
A professional trader using confluence does not take every signal. They are selective. They wait patiently for the “A+” setup, where multiple factors align. Their checklist before entering a trade might look like this:
Is the market in a clear, identifiable trend?
Does the pullback price align with a key Fibonacci retracement level (38.2%, 50%, or 61.8%)?
Does this Fibonacci level coincide with a horizontal support or resistance level?
Is a major moving average also providing support or resistance in this same price zone?
Is an oscillator indicating an oversold or overbought condition, or better yet, a momentum divergence?
Is there a specific candlestick pattern (like a hammer, doji, or engulfing bar) forming at this confluence zone to confirm the reversal?
Not every trade will tick every box. But the more boxes that are ticked, the higher the probability of the trade working out. This systematic, evidence-based approach removes emotion and guesswork.
It transforms trading from a gamble into a calculated business of risk management and probability. The essence of confluence is simple: do not trust a single witness. Build a compelling case backed by multiple, credible sources of information.
A chart is more than a record of price; it is a map of human emotion. Every tick up represents hope and greed. Every tick down signifies fear and panic. In this arena of financial conflict, traders constantly search for tools to impose order on the chaos. Few tools are as intertwined with market psychology as the Fibonacci sequence.
These mathematical ratios appear to tap directly into the collective consciousness of buyers and sellers. The question that has echoed through trading floors for decades is, why? Are these levels a form of market prophecy, or is their power derived from the simple fact that millions of traders believe in them?
The Self-Fulfilling Prophecy
The debate surrounding Fibonacci’s efficacy is central to understanding its role. Skeptics argue that if enough market participants watch the same levels and place orders at those levels, the levels will naturally become significant. A hedge fund algorithm, a bank’s trading desk, and a retail trader at home might all identify the 61.8% retracement level on the EUR/USD chart.
Consequently, a massive pool of buy orders accumulates at that price. When the market pulls back to this point, the surge of buy orders is triggered, creating a bounce. The level worked, not because of a mystical property, but because it became a focal point for planned action. It is a classic self-fulfilling prophecy.
This perspective does not diminish the tool’s utility. In fact, it reinforces it. If a trader knows where the institutional orders are likely clustered, they have a significant edge.
The power of Fibonacci, in this view, comes from its widespread adoption. It provides a common framework for millions of independent actors, organizing their collective behavior into predictable patterns. A trader using Fibonacci is not predicting the future. They are reading the intentions of the crowd.
Fear, Greed, and the Golden Ratio
To see the psychology in action, consider a classic uptrend. The initial move, the impulse wave, is fueled by greed. Buyers see momentum and jump in, hoping to profit from rising prices. This initial buying pressure creates a strong upward swing. But no market moves in a straight line forever. At some point, the momentum wanes.
This is where fear enters the equation.
Early Buyers: Those who entered near the bottom of the move are sitting on substantial profits. As the upward momentum slows, they become fearful of giving back those gains and begin to sell to lock in their winnings.
Late Buyers: Traders who entered near the top of the impulse move are now in a precarious position. The slightest dip puts their position into a loss. Fear of a larger reversal causes them to sell, often at a small loss, to avoid a bigger one.
Sidelined Sellers: Short sellers who were waiting for the trend to exhaust itself see the pullback as their opportunity. They begin to enter sell orders, adding to the downward pressure.
This confluence of selling creates the retracement. The price begins to fall. The critical question for everyone watching is: where will it stop? This is where Fibonacci levels provide a roadmap of psychological battlegrounds. The 61.8% level, the “golden ratio,” is often the most significant. It represents a deep pullback, a point where the fear of a complete trend reversal is at its peak.
It is a moment of maximum tension. If buyers step in here and overpower the sellers, it is a powerful statement that the original greed for higher prices remains the dominant market force. A bounce from this level is not just a technical event; it is a psychological victory.
Psychological Anchors on the Chart
Each Fibonacci level acts as a psychological “anchor,” a reference point that influences decision-making. Traders anchor their expectations of support or resistance to these lines.
The 38.2% Level: A pullback to this level is shallow. It signals immense confidence among the bulls in an uptrend. The profit-taking was minimal, and new buyers were so eager to join the trend that they did not wait for a bigger discount. It projects an image of strength and urgency.
The 50% Level: This is not a formal Fibonacci number, but it is included in most tools because of its immense psychological weight. A 50% retracement means the market has given back exactly half of its prior gain.
It represents perfect equilibrium. The battle between buyers and sellers is evenly matched. A bounce from here is significant because it shows the bulls have successfully defended the halfway point and wrestled back control.
The 61.8% Level: This is the line in the sand for many professional traders. It represents a substantial discount from the peak and a prime opportunity to enter if the trend is still valid. The psychology is complex. Traders who missed the initial move see it as their ideal entry.
Those already in the trend feel the acute pain of watching over half their paper profits evaporate. A decisive hold of this level often triggers a wave of new buying, as it confirms the trend’s resilience.
The Amplifier Effect of Algorithmic Trading
In modern markets, this psychology is amplified by machines. Institutional trading is dominated by algorithms. These are computer programs designed to execute trades based on predefined rules. A significant portion of these algorithms are programmed to recognize and act on Fibonacci levels.
When a major currency pair like the GBP/JPY starts to retrace toward its 61.8% level, it is not just human traders who notice. A multitude of institutional algorithms also identify this exact price. They are programmed to execute enormous buy orders at or near that level. This creates an invisible wall of demand.
The moment the price touches the zone, these high-speed algorithms fire, absorbing the selling pressure and often causing a sharp reversal. The retail trader who placed a buy order at that level was correct, but their individual order was insignificant. The move was driven by the institutional weight of automated systems all acting on the same psychological principle, a principle first coded by a human.
The Danger of Confirmation Bias
A responsible, journalistic approach requires acknowledging the tool’s limitations. The most significant psychological trap for a trader using Fibonacci is confirmation bias. This is the tendency to search for, interpret, and recall information in a way that confirms one’s preexisting beliefs.
A trader will vividly remember the one time they bought the 61.8% retracement perfectly and the market soared, creating a massive profit. They will conveniently forget the three other times the price sliced right through the level and stopped them out for a loss. The human brain is a pattern-recognition machine, and it can easily impose patterns where none exist.
Looking at a historical chart, it is simple to find Fibonacci levels that appear to have worked perfectly. This retrospective fitting is deceptive and creates a false sense of the tool’s predictive power. A professional analyst actively fights this bias. They do not seek to prove the tool works; they seek to identify, with objectivity, the instances where it provides a statistical edge.
Trading the Reaction, Not the Level
Understanding the psychology behind Fibonacci levels transforms how a trader interacts with them. An amateur sees the 61.8% level and places a blind buy order, hoping it holds. A professional sees the 61.8% level as a “region of interest.” They do not trade the level itself. They trade the market’s reaction to the level.
They watch as the price approaches this key psychological battleground. They observe the candlesticks. Do sellers appear to be running out of momentum? Do long wicks appear, indicating buyers are starting to push back? Do they see a strong, bullish engulfing candle form right at the level?
This confirmation signal is the evidence they need. It is the market communicating that the psychological battle is over and the buyers have won.
The entry is based not on a mathematical line, but on a confirmed shift in collective human behavior. This mindful approach removes the emotion of hope and replaces it with a strategy of observation and execution.
The trading chart is a battlefield document. It records the skirmishes between buyers and sellers, minute by minute, day by day. To the untrained eye, it is a mess of jagged lines and chaotic impulses. A seasoned trader sees something else. They see patterns.
They see structure. Most importantly, they see context. Before any indicator is applied, before any button is clicked, the successful trader asks a fundamental question: Is the market moving with purpose, or is it trapped in a fight with itself?
This is the distinction between a trending market and a ranging one. It is the single most important piece of information on the screen, and it dictates the correct application of any tool, especially the sequence of ratios known as Fibonacci.
The Anatomy of a Trend
A market in a trend has direction. It makes progress. In an uptrend, this progress is marked by a series of higher highs and higher lows. Each new peak surpasses the last, and each valley finds its bottom at a higher level than the one before.
This is the footprint of consistent buying pressure. Sellers attempt to push the price down, but buyers consistently overwhelm them at progressively higher prices. A downtrend is the mirror image: a sequence of lower lows and lower highs.
Sellers are in command. Buyers attempt to rally, but their efforts fail, and the price falls to new depths.
This structure of impulse and correction is where the Fibonacci retracement tool finds its primary function. The logic is rooted in market behavior. A strong move in the direction of the trend is called an impulse wave. Following this burst of activity, the market often takes a breath. This is the retracement or pullback.
It is a period of profit-taking or a counter-move from the opposing side. The trend has not ended. It is simply pausing. The Fibonacci retracement tool helps projects where this pause might find support or resistance before the original trend resumes.
The trader’s goal is to enter the market at the end of the retracement, positioning for the next impulse wave.
Fibonacci’s Role in a Trending Environment
Applying the tool requires precision. In a clear uptrend, the trader identifies a significant swing low and a subsequent swing high. The Fibonacci tool is drawn from the low point to the high point. This action overlays a series of horizontal lines on the chart at key percentage levels of the total move.
The most watched levels are 38.2%, 50%, and 61.8%. These are not arbitrary numbers. They are derived from a mathematical sequence discovered centuries ago, but their relevance in financial markets comes from collective human psychology and algorithmic execution.
Each level tells a story about the strength of the trend. A shallow pullback that finds support at the 38.2% level signals significant strength. The market is eager to continue its upward journey. Buyers stepped in quickly, unwilling to let the price drop further. A retracement to the 50% level indicates a more balanced pause. It is a common and healthy pullback.
A deep retracement to the 61.8% level, often called the golden ratio, represents a more serious test of the trend. It shows sellers were able to force a substantial correction.
A bounce from this level, however, can provide a high-conviction entry point, as it suggests the trend has withstood a significant challenge and is ready to resume. For a downtrend, the application is inverted. The tool is drawn from a swing high down to a swing low, with the levels now acting as potential resistance points for a rally.
The Sideways Shuffle: Markets in Consolidation
Not all markets trend. Many spend considerable time in consolidation, known as a ranging market. Here, the price is contained between a clear level of support below and resistance above. Buyers and sellers are in a state of equilibrium.
Buyers defend the support level, and sellers defend the resistance level. The price action appears to move sideways, bouncing between these two boundaries. There are no higher highs and higher lows. There are no lower lows and lower highs. There is only a struggle for control with no clear victor.
This environment is notoriously difficult for trend-following systems. A strategy designed to buy pullbacks in an uptrend will fail because there is no uptrend to resume. Entries are taken, only to see the price reverse at the top of the range.
Likewise, a strategy to sell rallies in a downtrend gets stopped out as the price bounces off the bottom of the range.
Applying Fibonacci retracements in the standard way during a range is a common error. Drawing the tool from a low to a high within the range will provide levels, but these levels lack the critical context of a directional trend. They become noise, not signals.
Applying Fibonacci in a Ranging Market
An unconventional analyst does not discard a tool simply because the textbook context is absent. They adapt. While standard retracement application is ill-advised in a range, Fibonacci can be repurposed. One method involves using the ratios to analyze the internal structure of the range itself.
By drawing the Fibonacci tool from the high of the range to the low of the range, a trader can identify a 50% line. This midpoint of the range often acts as a significant pivot. Price action above the 50% line shows short-term strength, while action below it shows short-term weakness. Trades can be initiated at the boundaries of the range with a target toward this midpoint.
Another advanced application involves using Fibonacci extensions, a topic for another day, to project breakout targets. When a price is contained in a range, it will eventually break out. By measuring the height of the range and applying Fibonacci projection ratios, a trader can set logical price targets for where the breakout move might travel.
This shifts the tool’s purpose from identifying entries within a trend to setting profit targets after a period of consolidation has ended. This requires patience. The trader is not acting inside the range but is waiting for the range to break.
Common Pitfalls and Misinterpretations
The effectiveness of any tool is limited by the skill of its operator. With Fibonacci, several common errors lead to poor results. The first is improper placement of the swing points. The selection of the swing low and swing high that define the impulse move is subjective. Choosing insignificant minor swings instead of major, structural ones will produce unreliable levels.
The chosen swing points must represent a clear, committed move by the market.A second major pitfall is using the Fibonacci levels in isolation. No single indicator is a complete trading system.
A Fibonacci level is an area of potential support or resistance. It is not a guarantee. A prudent trader looks for confluence. They wait for other signals to align with the Fibonacci level. This could be a candlestick reversal pattern, a moving average acting as support, or an oversold reading on an oscillator. When multiple, independent signals point to the same conclusion, the probability of a successful trade increases substantially.
The Fibonacci level becomes one piece of evidence, not the entire case. Finally, the most fundamental error is ignoring the market context. A trader must first classify the market as trending or ranging. Applying a trend-based Fibonacci strategy in a ranging market is a flawed premise from the start. Market structure analysis always comes first.
The tool is secondary to understanding the environment. The numbers on the chart mean nothing without the story behind them.
When trading, the numbers on a chart tell a story. It is a story of rhythm, of ebb and flow, of expansion and contraction. This narrative can sometimes be interpreted through a mathematical sequence introduced to the West in the 13th century by the Italian mathematician Leonardo of Pisa, also known as Fibonacci.
The Fibonacci sequence is more than a historical curiosity. It is a practical method of technical analysis used to highlight potential areas traders monitor for support and resistance. Understanding its application provides a framework, a structured approach for analysing market behaviour.
This is not about a magic formula. It is about applying a mathematical principle to gauge market sentiment and identify potential turning points. The sequence itself is simple: 0, 1, 1, 2, 3, 5, 8, 13, 21, and so on, with each number being the sum of the two preceding ones. The power lies in the ratios derived from these numbers.
These are levels that many traders watch when a market pulls back, as they are often treated as potential zones of interest. This guide provides an in-depth analysis of Fibonacci retracement, progressing from its basic application to advanced strategies, offering a structured framework rather than a guaranteed blueprint for the modern trader.
What is the Core Principle of Fibonacci Retracement?
The fundamental idea behind Fibonacci retracement is that after a significant price move in one direction, the price will retrace or pull back a predictable portion of that move before continuing in the original direction.
Traders use Fibonacci levels to pinpoint these potential reversal points. The tool is drawn by identifying two extreme points on a chart, such as a significant swing high and swing low. The vertical distance between these two points is then divided by the key Fibonacci ratios.
These key ratios are not arbitrary. They are derived from the mathematical relationships within the Fibonacci sequence.
61.8%: Known as the “golden ratio,” this is derived by dividing any number in the sequence by the number that follows it. As the sequence progresses, this ratio approaches the golden ratio, 0.618.
38.2%: This ratio is found by dividing a number in the sequence by the number two places to its right.
23.6%: This comes from dividing a number by the number three places to its right.
These ratios translate into horizontal lines on a chart that function as potential support or resistance levels.
For instance, in a strong uptrend, a pullback to the 38.2% level is often observed. If the price finds support at this level and bounces, it may indicate a continuation of the uptrend. A deeper pullback to the 61.8% level, often referred to as the “golden retracement,” is sometimes monitored, but it is a critical zone for a potential reversal.
The 50% level, though not an official Fibonacci ratio, is included by most charting platforms because prices have been seen to reverse after retracing half of a prior move.
Reading the Market: How is Fibonacci Applied in Trending vs. Ranging Markets?
The effectiveness of Fibonacci retracement is highly dependent on market conditions. The tool is most reliable in a clearly defined trending market, either bullish or bearish. In an uptrend, traders draw the Fibonacci levels from a significant swing low to a subsequent swing high.
The resulting retracement levels below the high are often viewed as potential support zones where one could look for buying opportunities, anticipating a bounce and continuation of the uptrend. Conversely, in a downtrend, the levels are drawn from a swing high to a swing low.
The retracement levels above the low are potential resistance zones, which some traders may view as potential resistance zones.
The story changes in a ranging or sideways market. When a currency pair shows no clear directional trend and its price fluctuates between a defined high and low, applying Fibonacci retracement becomes less effective and often generates misleading signals.
Ranging markets lack the strong impulse moves that establish the clear swing points needed for a reliable Fibonacci analysis.
Using the tool in such conditions is a common mistake, as the price is not “retracing” in the context of a larger trend but is simply oscillating.
In these scenarios, other technical indicators, such as Bollinger Bands or oscillators like the Relative Strength Index (RSI), are often more suitable for identifying overbought and oversold conditions within the range. The key is first to recognise the prevailing market structure. A trending market provides the necessary momentum for Fibonacci levels to act as meaningful inflection points.
The Trader’s Mind: What is the Psychology of Fibonacci Levels?
The predictive power of Fibonacci levels is a subject of debate. A prominent argument is that their effectiveness stems from being a self-fulfilling prophecy. Because a vast number of market participants, from individual retail traders to large institutional desks, are aware of and use these levels, they naturally become commonly observed areas of support and resistance.
When a price approaches a widely watched Fibonacci level, such as 61.8%, a large number of buy or sell orders are triggered.
This collective action is what causes the price to reverse. A trader seeing a pullback in an uptrend might place a buy order at the 38.2% retracement level with a stop-loss just below the 50% level. Millions of other traders might be doing the same. This flood of buy orders provides the support needed to push the price back up.
This psychological component is critical. The levels often gain significance because they are widely recognised and used. The numbers themselves have no inherent predictive ability in financial markets.
Their power is derived from the shared belief and coordinated actions of market participants. This also means that when a key Fibonacci level fails to hold, the subsequent price movement can be swift and decisive.
A break below a key support level like 61.8% can trigger a cascade of stop-loss orders, adding to the selling pressure and accelerating the downward move. Therefore, a trader using Fibonacci must understand that they are not just trading numbers. They reflect a collective market psychology.
Confluence is Key: Why Combine Fibonacci with Other Indicators?
Relying solely on Fibonacci retracement for trading decisions may be limiting. The most robust trading strategies are built on the principle of confluence. Confluence occurs when multiple independent technical indicators highlight the same area, which some traders interpret as a stronger zone of interest.
Consider a scenario where the 61.8% Fibonacci retracement level of a recent uptrend lines up perfectly with a 200-period moving average.
The 200-period moving average is itself a significant long-term indicator of support and resistance. When the price pulls back to this combined level, it is seen by some as carrying additional analytical significance.
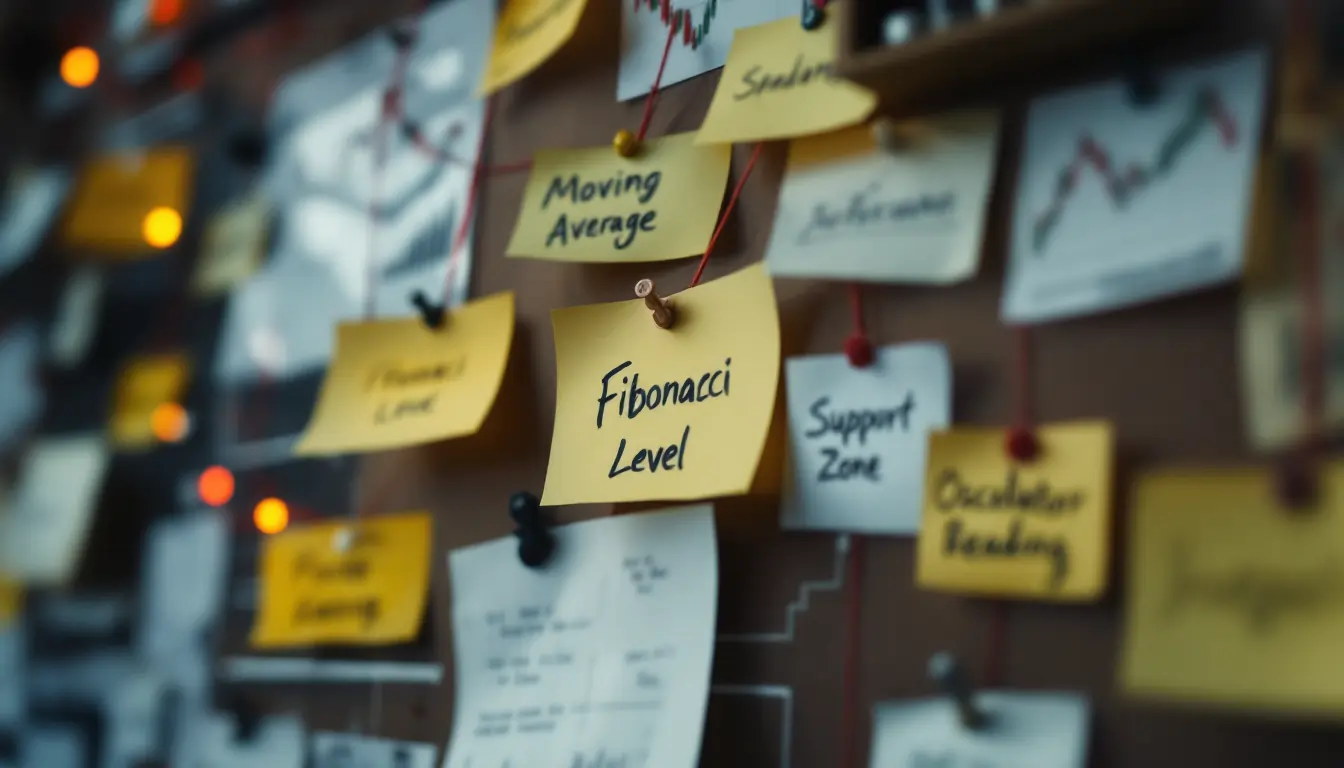
Other indicators that pair well with Fibonacci include:
Support and Resistance Levels: A historical price level where the market has previously reversed becomes more significant if it aligns with a Fibonacci ratio.
Trendlines: A rising trendline in an uptrend can intersect with a Fibonacci retracement level, creating a powerful support zone.
Candlestick Patterns: The appearance of a bullish reversal pattern, like a hammer or a bullish engulfing pattern, at a Fibonacci support level can provide further analytical context.
Oscillators: An RSI or MACD reading in the oversold territory at a Fibonacci support level may suggest slowing momentum, which traders then interpret alongside Fibonacci.
When such tools align, they are often used as a filter to help reduce false signals and highlight areas of interest.
Fibonacci and Your Bottom Line: How Do You Apply Advanced Risk Management?
Profitability in trading is not just about picking winning entries. It is about disciplined risk management. Fibonacci retracement can provide a structured framework for managing risk. One common application is in setting stop-loss orders.
When entering a trade at a Fibonacci level, the stop-loss is typically placed just beyond the next level. For example, if a trader enters a long position at the 38.2% retracement level, they might place their stop-loss order just below the 50% or 61.8% level. The idea is that a break through multiple levels could suggest the original trend view is less valid.
This approach allows for a calculated risk-to-reward ratio. Before entering a trade, a trader can define their exact entry point, their exit point if the trade goes wrong, and their profit target. This allows for precise position sizing. A trader can adjust the size of their position to ensure that the potential loss on any single trade is a small, acceptable percentage of their total trading capital.
Advanced risk management with Fibonacci also involves scaling into positions. Instead of entering a full position at a single level, a trader might enter a partial position at the 38.2% level, add to it at the 50% level, and add a final portion at the 61.8% level.
This method spreads out entry points and adjusts the average entry price if the pullback is deeper than anticipated.
Beyond Retracements: How Do You Use Fibonacci Extensions to Set Profit Targets?
While Fibonacci retracement helps identify entry points, Fibonacci extensions help define exit points. Extensions are used to project where the price might go following a retracement. They are levels drawn beyond the original price move. The key Fibonacci extension levels are 127.2%, 161.8%, and 261.8%. The 161.8% level is particularly significant, as it is the golden ratio applied to price projection.
To use Fibonacci extensions, a trader needs three points: the start of a move, the end of that move, and the end of the subsequent retracement. For an uptrend, this would be a swing low, a swing high, and the low of the pullback.
The extension tool then projects potential profit targets above the swing high. For example, after a price bounces off the 50% retracement level, a trader might set their first profit target at the 127.2% extension and a second target at the 161.8% extension.
These extension levels can act as reference zones where traders may consider taking partial or full profits, depending on their plan.
Time is on Your Side: Does Fibonacci Work Across Different Trading Timeframes?
The beauty of the Fibonacci sequence is its fractal nature. The patterns and ratios repeat across all scales. This means that Fibonacci retracement and extension tools can be applied to any timeframe, from a one-minute chart for a scalper to a weekly or monthly chart for a long-term position trader.
The principles remain the same. On a 15-minute chart, a trader might use Fibonacci to analyse a price swing that occurred over a few hours. On a daily chart, the same tool could be used to analyse a trend that has been developing for months.
The consistency across timeframes is a powerful feature. It allows traders to align their entries with the larger market trend. For instance, a long-term position trader might identify a major uptrend on the weekly chart and see that the price is pulling back to the 38.2% retracement level.
A swing trader, looking at the daily chart, might wait for the cost to hit that same weekly support level and then look for a bullish entry signal on the daily chart. A day trader could go even further, waiting for the price to reach this central support zone and then using a 5-minute chart to time their entry with precision.
This multi-timeframe analysis is one approach traders may use to provide context for shorter-term setups.
Does It Actually Work? How to Backtest Your Fibonacci Trading Strategy
No trading strategy should be deployed with real capital until it has been thoroughly backtested. Backtesting is the process of applying a trading strategy to historical price data to determine its effectiveness.
For a Fibonacci-based strategy, this involves revisiting past charts and simulating trades based on predefined rules.
Some analyses have questioned the standalone reliability of the tool. Arthur Merrill in Filtered Waves determined there is no reliably standard retracement, a conclusion that suggests price volatility may be a more significant factor than a mystical sequence.
The appearance of retracements can sometimes be ascribed to the random fluctuations inherent in market price action.
This does not mean the tool is useless, but it highlights the importance of using it in conjunction with other tools. The process for backtesting a refined, confluence-based Fibonacci strategy is systematic:
Define Strict Rules: First, establish a clear and unambiguous set of rules for your strategy.
Select a Market and Timeframe: Choose the currency pair and the chart timeframe you intend to trade.
Gather Historical Data: Use a trading platform that allows you to scroll back through historical price data.
Simulate Trades: Manually review the data, bar by bar, and identify every setup that meets your trading rules.
Analyse the Results: After simulating a large number of trades (at least 100), analyse the data. Calculate the win rate, the average win, the average loss, and the risk-to-reward ratio.
This process provides an objective measure of a strategy’s historical performance. It might reveal that specific rules are not profitable and need adjustment.
Backtesting can help traders gain more familiarity with their strategy and refine their approach based on what the historical data reveals.
Fibonacci in Action: Real-World Case Studies of Winning and Losing Trades
Theory is one thing; real-world application is another. Examining case studies reveals how these principles are applied in real-world markets.
Case Study 1: A Winning Trade in a Trending Market
Consider the EUR/USD currency pair during a consistent uptrend. After identifying a significant high and low, a trader applies Fibonacci retracement levels. The price retraces to the 61.8% level and begins to stabilise.
The trader then notices a bullish candlestick pattern and an oversold signal on the RSI, prompting an entry. This confluence of indicators highlighted a potential area of support. The trade outcome aligned with the expectation of the trend continuing.
This example illustrates how Fibonacci retracement can be combined with other tools to help identify areas of interest, though outcomes can vary depending on market conditions.
Case Study 2: A Losing Trade in a Choppy Market
Now, imagine a currency pair in a choppy, sideways market. The price has been oscillating without a clear direction for several days. A trader, eager to find a setup, identifies what appears to be a minor downtrend within the range. They apply the Fibonacci retracement tool to this small move and wait for a pullback. The price rallies to the 50% retracement level.
The trader enters a short position, anticipating continuation of the minor trend
However, because the broader market lacked directional momentum, the retracement level offered limited guidance. The position did not play out as anticipated.
This example shows how applying Fibonacci retracement in non-trending conditions may reduce its effectiveness, underscoring the importance of context. For more on this, see mistakes to avoid.
Closing Remarks
Fibonacci retracement is not a predictive machine. It is a framework for analysis. It provides structure to the apparent chaos of price action. Its lines on a chart are reference points,that some traders use potential zones where the psychology of the market might shift and cause a trend to resume or reverse.
These levels gain significance from the sheer number of traders who watch them, transforming a mathematical curiosity into a commonly applied tool for market analysis
The framework, therefore, is useless without a skilled architect. The trader’s discipline in applying the tool within a trending market, confirming signals with other indicators, managing risk with precision, and backtesting every assumption determines the outcome.
A Final Word About Risk
No indicator or trading strategy guarantees profit. Forex trading involves substantial risk, and you should never invest capital that you cannot afford to lose.
The Fibonacci retracement tool is a method for identifying potential opportunities, not a crystal ball. Its effectiveness is tied to a disciplined trading plan, strong risk management, and the confirmation of other indicators.
Every single trade you take must have a predefined stop-loss to protect your account. The market’s direction is never certain. Your risk, however, must always be defined and controlled.
Your long-term success as a trader depends not on your winning trades, but on how you manage your losing ones.
Approach every setup with this principle at the forefront of your mind.
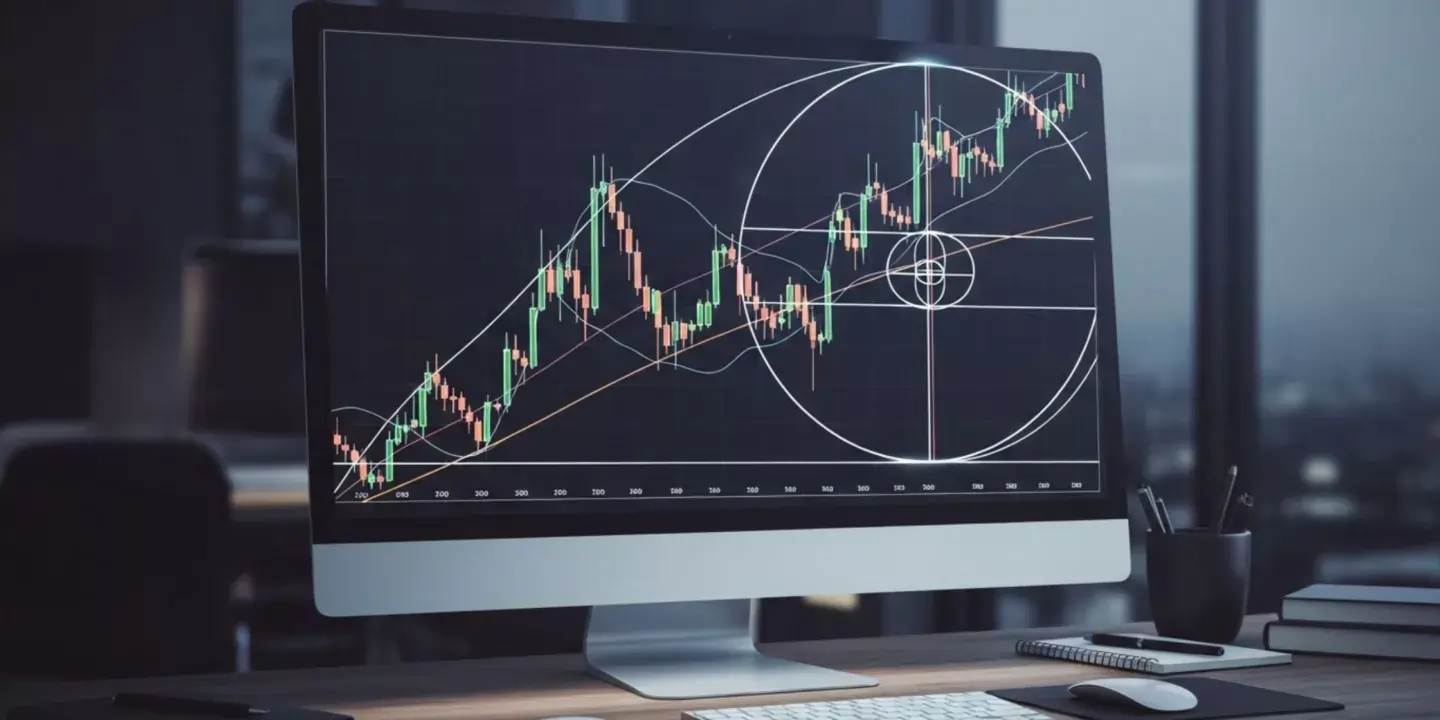
From the spiral of a seashell to the grandeur of ancient architecture, the Golden Ratio (Phi) has fascinated thinkers for millennia. But what if this universal constant, this mathematical concept, may offer a way to interpret market movements in CFD trading?
At YWO.com, we explore how Fibonacci trading principles offer a profound lens through which to view financial markets, providing traders with an alternative mathematical perspective.
This article will guide you through the Fibonacci sequence and its powerful application in technical analysis Fibonacci.
We’ll move from theoretical underpinnings to practical trading strategies, illustrating how these ratios are often used to identify potential support and resistance levels, suggest possible price zones, and inform broader risk management approaches.
Decoding the Golden Ratio & Fibonacci Sequence
The journey into Fibonacci trading begins with understanding its core components: the Golden Ratio and the Fibonacci sequence.
What is the Golden Ratio (Phi) and Why Does it Matter?
The Golden Ratio, approximately 1.618 (and its inverse, 0.618), is a number derived from a unique mathematical relationship where the ratio of the sum of two quantities to the larger quantity is equal to the ratio of the larger quantity to the smaller one.
Represented by the Greek letter Phi (Φ), this proportion appears ubiquitously in nature, art, and even human anatomy. In financial markets, some analysts believe that market psychology and collective behavior can appear to align with these ratios, though this remains an interpretive framework.
The Fibonacci Sequence: Nature’s Secret Code
The Fibonacci sequence, discovered by Leonardo Fibonacci, is a series of numbers where each number is the sum of the two preceding ones (0, 1, 1, 2, 3, 5, 8, 13, 21, 34, …).
What makes this sequence critical for trading with Fibonacci is the relationship between its numbers. As you progress, the ratio of any number to its preceding number approaches 1.618 (e.g., 34/21 ≈ 1.619), while the ratio to the number two places before it approaches 2.618 (e.g., 34/13 ≈ 2.615).
These ratios, particularly 0.618 (the inverse of 1.618), 0.382, and 0.236, form the bedrock of Fibonacci retracement and Fibonacci extension tools.
The Psychological & Mathematical Basis of Fibonacci in Markets
Why do technical analysis Fibonacci tools are often applied in Forex or stock market environments? It’s largely attributed to human psychology and the collective behavior of traders.
Markets, driven by fear and greed, often exhibit herd dynamics that may lead to recurring reactions at certain price points. These reactions are sometimes observed near Fibonacci levels.
As market prices move, they typically don’t move in a straight line. Instead, they exhibit market cycles of expansion, contraction, and retracement. After a significant price move, markets often “correct” or “retrace” a portion of that move before continuing in the original direction.
These retracements are often monitored at the retracement levels of 38.2%, 50%, and 61.8%, which are linked to the Fibonacci sequence.
Core Fibonacci Tools in Technical Analysis
Using Fibonacci tools in technical analysis typically involves understanding their main applications
Fibonacci Retracement: Highlighting Potential Support & Resistance
The Fibonacci Retracement Tool is arguably the most popular Fibonacci trading instrument.
It is used by traders to identify potential areas of support and resistance where price might react. To draw Fibonacci Retracements accurately, you connect two extreme points: a swing high and a swing low for an uptrend, or a swing low and a swing high for a downtrend.
The most watched key retracement levels are:
23.6%: A minor retracement, often seen in strong trends.
38.2%: A significant level; often a first point of interest for buyers/sellers.
50%: While not a direct Fibonacci number, it represents the midpoint of a move and is widely followed as a psychological level.
A Final Word on Risk No indicator or trading strategy guarantees profit. Forex trading involves substantial risk, and you should never invest capital that you cannot afford to lose.
The Fibonacci retracement tool is a method for identifying potential opportunities, not a crystal ball. Its effectiveness is tied to a disciplined trading plan, strong risk management, and the confirmation of other indicators.
Every single trade you take must have a predefined stop-loss to protect your account. The market’s direction is never certain. Your risk, however, must always be defined and controlled.
Your long-term success as a trader depends not on your winning trades, but on how you manage your losing ones.
Approach every setup with this principle at the forefront of your mind.
Fibonacci analysis is widely used in technical trading, and when applied carefully, it can offer a structured way of examining potential market levels.
The “golden ratio”, with its ties to natural patterns, is often referenced as a framework for identifying possible areas of support and resistance in markets such as forex, indices, and commodities.
Yet, like any potent tool, it requires careful application; missteps in Fibonacci analysis can reduce effectiveness and lead to inconsistent results.
This guide will explore the 5 common Fibonacci errors that consistently trip up traders, from beginners to those with some experience.
More importantly, it outlines practical approaches that may help in avoiding these pitfalls, supporting a more disciplined use of Fibonacci techniques within broader market analysis.
The Foundation: A Quick Refresher on Fibonacci in Trading
Before we delve into the errors, let’s briefly revisit the core principles. Fibonacci analysis is a technical analysis method that uses sequences of numbers identified by the 13th-century mathematician Leonardo Pisano, known as Fibonacci.
What is Fibonacci and Why Traders Use It
The Fibonacci sequence in trading is a series of numbers where each number is the sum of the two preceding ones (e.g., 0, 1, 1, 2, 3, 5, 8, 13, 21, 34…). When we derive ratios from these numbers, specific percentages emerge that are often observed in financial markets.
Traders use these ratios to highlight potential areas of support and resistance, monitor possible price levels, and assess retracements or extensions.
It’s a cornerstone of technical analysis, applicable across forex trading, stock market indices, and commodities in CFD trading.
Understanding Key Retracement and Extension Levels
The most commonly used Fibonacci retracement levels are 23.6%, 38.2%, 50%, 61.8%, and 78.6%. These levels suggest where a price pullback may potentially pause before the original trend resumes.
For Fibonacci extension, popular levels include 127.2%, 161.8%, 200%, and 261.8%, which are often used to project potential price areas once a market moves beyond a prior high or low.
Mistake 1: Ignoring the Overarching Trend & Market Context
One of the most frequent common Fibonacci errors is applying Fibonacci levels in isolation, without considering the broader market direction. This is akin to navigating a ship without knowing the ocean’s currents.
Why ‘Blind’ Fibonacci can be misleading
A trader might identify a 61.8% retracement level on a chart, but if the market’s overarching trend is strongly bearish, that seemingly perfect level could be easily breached.
Fibonacci analysis mistakes often stem from a lack of market context, resulting in trades that move against prevailing momentum. The market’s rhythm, driven by fundamental news or strong momentum, can easily overshadow individual indicator signals.
Solution: Always Confirm with Macro Trend Analysis & Price Action
The most effective way to use Fibonacci is with the trend. Always identify the dominant trend first, whether bullish or bearish, using tools like moving averages, trend lines, or higher timeframe analysis.
Then, look for Fibonacci retracements within that trend to find potential entry points. Confirm these levels with price action trading signals, such as strong candlestick patterns or rejection from a trend line. This combined approach may improve the consistency of analysis.
For broader perspective, integrating global economic indicators can also support trend evaluation as discussed at Bloomberg Markets.
Mistake 2: Incorrectly Drawing Fibonacci Levels
This might sound basic, but incorrect Fibonacci levels are a primary source of frustration. Many traders struggle with identifying the correct swing high and swing low to anchor their Fibonacci tool.
The Critical Error of Misplaced Anchor Points
Drawing Fibonacci retracements requires selecting a significant swing low and a significant swing high (for an uptrend pullback) or vice versa (for a downtrend pullback).
Traders often make the mistake of picking minor fluctuations, arbitrary points, or using a range that isn’t reflective of a clear impulse move. This leads to Fibonacci retracement errors where the calculated levels are irrelevant to actual market movement.
Solution: Master the Swing Highs and Lows with Precision
A ‘swing high’ is typically a high point with at least two lower highs on either side. A ‘swing low’ is a low point with at least two higher lows on either side. Practice identifying these definitive pivot points on various timeframes.
For an uptrend, draw from the swing low to the swing high. For a downtrend, draw from the swing high to the swing low. The accuracy of your anchor points plays a major role in the relevance of your Fibonacci analysis.
Mistake 3: Relying Solely on Fibonacci without Confluence
Just as a single instrument rarely forms an entire orchestra, a single indicator like Fibonacci rarely provides a complete trading signal. This is a crucial pitfall in avoiding Fibonacci pitfalls.
The Danger of Single-Indicator Syndrome
Many traders fall into the trap of using Fibonacci as their sole decision-making tool. They see a price hit a 61.8% retracement and immediately initiate a trade.
However, markets are complex, influenced by multiple factors. Relying only on Fibonacci, without additional confirmation, significantly increases the risk ofmissed opportunities, especially during volatile conditions.
Solution: Combine with Support/Resistance, Candlesticks, and Volume for Confirmation
Successful trading Fibonacci effectively involves seeking confluence. This means looking for multiple technical indicators or patterns aligning at or near a Fibonacci level. For example, does a 61.8% retracement level coincide with a historical support/resistance zone?
Is there a candlestick reversal pattern forming at that level? Is volume Fibonacci supporting the potential reversal? Combining Fibonacci with other tools can create stronger confirmation signals.
Mistake 4: Inappropriate Timeframe Application
The market’s fractal nature means that patterns repeat across different timeframes. However, a Fibonacci analysis valid on a daily chart will likely be meaningless on a 5-minute chart.
Why a Daily Chart’s Fibonacci Won’t Work on a 5-Minute Chart
Applying Fibonacci levels drawn from a broad, multi-day price move to a short-term, intraday chart is a classic Fibonacci analysis mistake.
The underlying market drivers, participant types, and price noise differ significantly between timeframes. Fibonacci levels are most effective when applied to a timeframe consistent with your overall trading strategy and horizon.
For instance, long-term analysis is often conducted on weekly or monthly charts, while shorter-term traders may look at 15-minute or 1-hour charts.
Solution: Align Your Fibonacci Analysis with Your Trading Style & Timeframe
Determine your primary trading timeframe first. Are you a swing trader holding positions for days? Focus on 4-hour or daily charts.
Are you a scalper looking for quick trades? Use 1-minute or 5-minute charts for your time frames Fibonacci analysis, but always be aware of the higher timeframe trend. Consistency in timeframe selection supports more coherent analysis.
[Insert Chart: Fibonacci on different timeframes showing varying validity, e.g., a Daily chart showing a clear 61.8% bounce, and a 5-minute chart showing the same Fibonacci levels being disregarded by intraday noise]
Mistake 5: Over-Trading and Letting Emotions Dictate Fibonacci Trades
Even with perfect analysis, trading psychology can derail a trader’s success. The desire to find a setup, or the fear of missing out (FOMO), often leads to forced Fibonacci trades.
The Psychological Trap of Forcing Fibonacci Setups
After diligently learning how to use Fibonacci correctly, traders can become overzealous, seeing Fibonacci setups everywhere. This often results in over-trading, where traders take lower-probability trades just because they’ve identified a Fibonacci level.
This emotional bias, coupled with a lack of discipline, can quickly erode capital. Understanding the role of greed and fear is an important part of risk awareness in CFD trading.
Solution: Develop a Trading Plan and Stick to Risk Management Principles
A solid trading plan is a helpful defence against emotional trading. It should clearly define your entry criteria (including Fibonacci confluence), exit strategy, and strict risk management Fibonacci rules.
Many traders use predefined stop-loss and take-profit levels to manage exposure. Position sizing and limiting risk on each trade are also widely emphasized as key components of long-term risk control.
For instance, place a stop-loss just beyond a significant Fibonacci retracement level if you anticipate a bounce. Adhering to these principles is essential for long-term survival and profitability. Gain deeper insights into managing your mental game with our guide on (FOMO) Silently Wrecking Your Account.
Learn more about risk management from financial authorities like the Financial Times.
Advanced Strategies: Elevating Your Fibonacci Analysis
Once you’ve understood the basics and avoided these common pitfalls, you may explore more advanced uses of Fibonacci.
Identifying Fibonacci Clusters and Confluence Zones
Look for areas where multiple Fibonacci levels from different price swings or different timeframes converge. These “clusters” are often monitored as stronger potential support or resistance zones.
Integrating Fibonacci with Elliott Wave Theory for Deeper Insights
Elliott Wave Theory postulates that markets move in predictable wave patterns driven by collective psychology. Fibonacci ratios are intrinsically linked to Elliott Wave, providing precise measurements for wave lengths and retracements.
This combination is used by some analysts to study market structure and possible price movement scenarios.
Leveraging Fibonacci for Precise Stop-Loss and Take-Profit Placement
Fibonacci extension levels are excellent tools for identifying potential take-profit targets, especially in strong trends. Similarly, placing stop-losses just beyond key retracement levels can offer logical and effective risk control.
If a significant Fibonacci level is broken, it may signal a shift in sentiment, prompting traders to reassess their analysis.
rade setup with Fibonacci SL/TP showing an entry at a 61.8% retracement, with SL below the 78.6% and TP at 161.8% extension.
Conclusion: Applying Fibonacci Thoughtfully
Fibonacci analysis is commonly referenced in the technical trader’s arsenal, yet its usefulness can be limited by avoidable Fibonacci mistakes.
By recognizing and addressing frequent errors – such as overlooking the trend, misplacing anchor points, relying on it in isolation, applying it across inconsistent timeframes, or letting emotions drive decisions – you may improve the consistency and structure of your analysis.
Key Takeaways for Applying Fibonacci
Always confirm the trend before applying Fibonacci.
Use clear swing high/low identification for drawing.
Seek confluence with other indicators like support/resistance and price action.
Align Fibonacci with your trading timeframe.
Adhere to a strict trading plan and risk management.
With careful use, Fibonacci analysis can support a more disciplined approach within technical analysis.
Practice Your Skills with a YWO.com Demo Account – Link to: Registration Link
Summary/TL;DR
Mistake 1: Ignoring Trend. Applying Fibonacci without considering the overarching market trend can reduce reliability. Approach: confirm with macro trend analysis and price action.
Mistake 2: Incorrect Drawing. Misplacing anchor points for Fibonacci retracement or extension reduces relevance. Approach: Focus on identifying significant swing highs and lows with precision.
Mistake 3: No Confluence. Relying solely on Fibonacci signals without additional confirmation. Approach: Combine with support/resistance, candlestick patterns, and volume for stronger signals.
Mistake 4: Inconsistent Timeframe. Using Fibonacci levels from one timeframe on another, inconsistent timeframe. Approach: Align your Fibonacci analysis with your specific trading style and timeframe.
Mistake 5: Emotional Over-trading. Forcing Fibonacci setups or trading without discipline. Approach: Apply a trading plan and maintain clear risk management rules.
A Final Word on Risk No indicator or trading strategy guarantees profit. Forex trading involves substantial risk, and you should never invest capital that you cannot afford to lose.
The Fibonacci retracement tool is a method for identifying potential opportunities, not a crystal ball. Its effectiveness is tied to a disciplined trading plan, strong risk management, and the confirmation of other indicators.
Every single trade you take must have a predefined stop-loss to protect your account. The market’s direction is never certain. Your risk, however, must always be defined and controlled. Your long-term success as a trader depends not on your winning trades, but on how you manage your losing ones.
Approach every setup with this principle at the forefront of your mind.
Frequently Asked Questions About Fibonacci Analysis
Q: What’s the ‘Golden Ratio’ in trading, and how does it relate to Fibonacci?
A: The ‘Golden Ratio’ is approximately 1.618 (or its inverse, 0.618), derived from the Fibonacci sequence. It appears naturally in many aspects of the universe and is sometimes referenced in financial markets.
In trading, levels such as 61.8% retracement and 161.8% extension are based on this ratio and are widely monitored, though not guaranteed indicators
Q: Can Fibonacci analysis predict market reversals with 100% accuracy?
A: No. There is no technical analysis tool that can predict market reversals with 100% accuracy. Fibonacci levels are probabilities, not certainties.
They indicate potential areas where price might react. Always use them in conjunction with other confirmation signals and a robust risk management strategy.
Q: How often should I adjust my Fibonacci levels on a chart?
A: Fibonacci levels are often adjusted when a new significant swing high or swing low forms, establishing a new clear impulse move.
As the market evolves, so too should your drawn Fibonacci ranges to remain relevant to the current price action.
Q: Are there specific market conditions where Fibonacci works best?
A: Fibonacci analysis tends to work best in trending markets where clear impulse waves and corrective retracements are visible.
In choppy, sideways, or highly volatile and unpredictable markets without clear trends, Fibonacci levels can be less reliable.
Q: What other tools complement Fibonacci for CFD trading?
A: For CFD trading, Fibonacci analysis is powerfully complemented by tools such as support and resistance levels, trend lines, moving averages, candlestick patterns, volume indicators, and momentum oscillators like the RSI or MACD.
Combining these creates a comprehensive analytical framework.