Tag: trading

  • Forex Trading for Beginners: Navigating Central Bank Shifts

    Forex Trading for Beginners: Navigating Central Bank Shifts

    In the sprawling and chaotic theater of global finance, there are many actors vying for attention. You have the hedge fund managers screaming into telephones on Wall Street.

    You have the day traders staring bleary eyed at multiple monitors in their basements. You have the multinational corporations quietly hedging their exposure to the price of aluminum in London. But sitting in the royal box, high above the chaos, are the true directors of the play. They are the Central Banks.

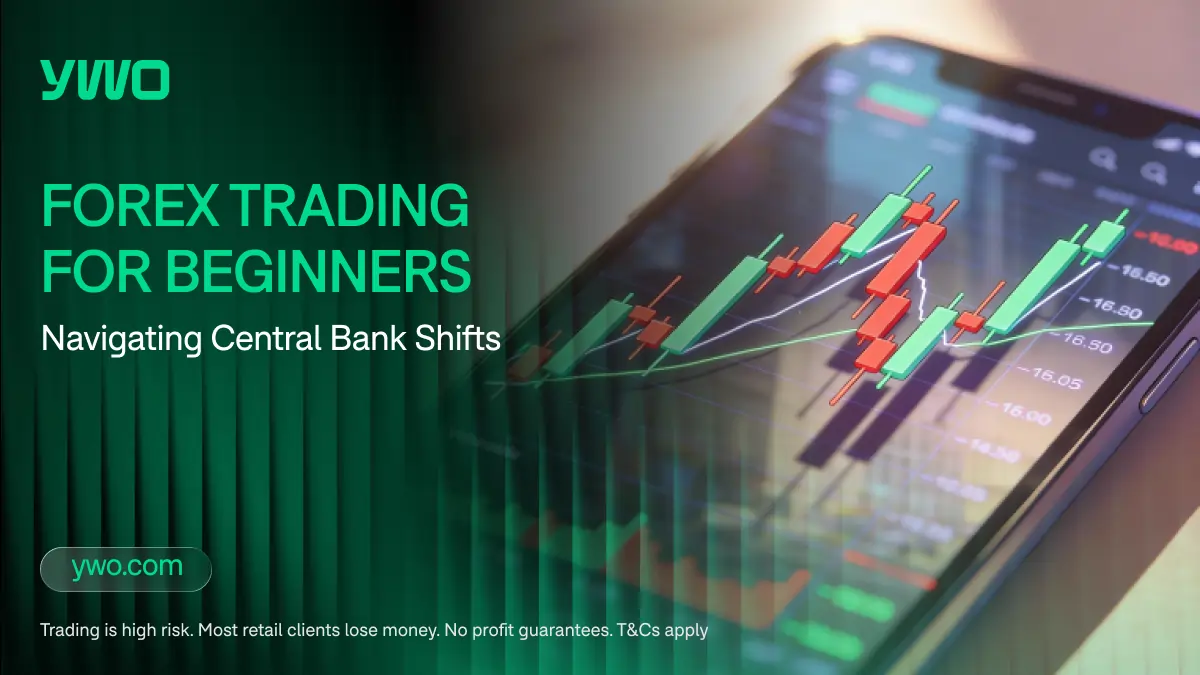
    For the beginner forex trader, understanding Central Banks is the difference between reading the daily weather report and understanding why the seasons change. You can trade the rain which is the daily price action. But without awareness of shifts in monetary policy, you may misinterpret larger structural trends.

    Central Banks like the Federal Reserve, the European Central Bank, and the Bank of Japan are the architects of money itself. They decide the cost of borrowing. They determine the supply of cash. By extension, they decide the value of the currency in your pocket. When they move, the earth shakes. When they whisper, markets panic. When they change their minds, trends that have lasted for years can reverse in an instant.

    This guide is not a dry economics lecture designed to put you to sleep. It is a practical framework.. We will decode the cryptic language of these institutions. We will explore how their policy shifts create the massive trends that define the forex market. And most importantly, we will discuss how a retail trader might navigate these treacherous waters without being capsized by the wake of a supertanker.

    Part 1: The Masters of the Universe and Their Motives

    To understand the game, you must first understand the players. Central Banks are not commercial banks. They do not care about your savings account or your mortgage rate or your credit score. They have a specific and often difficult mandate handed to them by their governments. Usually, this is a dual mandate.

    First, they must maintain Price Stability. This usually means keeping inflation under control, typically around a target of 2 percent. They want your coffee to cost roughly the same next year as it does today.

    Second, they must ensure Maximum Employment. They want to keep the economy growing fast enough so that people have jobs.

    These two goals are often in direct conflict. Tightening monetary policy to reduce inflation may slow economic activity. Easing policy to support growth may increase inflationary pressure. This policy trade-off is a central driver of currency market expectations. Market participants closely monitor how central banks balance these competing objectives..

    The Big Three

    While every country has a central bank, only a few truly matter for the global forex trader.

    The Federal Reserve (The Fed) is the central bank of the United States. Because the US Dollar is the world’s reserve currency, the Fed is effectively the central bank of the world. When the Fed sneezes, emerging markets catch pneumonia. Their decisions are the primary driver of global liquidity. If the Fed raises rates, money is sucked out of the global system and back into the US. If they cut rates, money floods out into the world seeking yield.

    The European Central Bank (ECB) is the guardian of the Euro. Their job is infinitely more complex because they manage a single currency for over twenty different countries. Germany has a different economy than Greece. France has different needs than Italy. The ECB tends to be slower, more conservative, and deeply concerned with consensus. They turn the ship slowly, but once they turn, the trend can last for a long time.

    The Bank of Japan (BoJ) is the eternal outlier. For decades, they fought deflation while the rest of the world fought inflation. They are the masters of massive intervention and unorthodox policies like Yield Curve Control. Trading the Yen often requires understanding that the BoJ plays by a completely different set of rules than everyone else.

    Part 2: The Hawk and the Dove and the Language of Money

    Central bankers speak a dialect known as “Fedspeak.” It is designed to be boring, ambiguous, and precise all at the same time. They will never say “We are going to raise rates next month.” They will say “We are monitoring the incoming data to assess the appropriateness of further policy firming.”

    However, beneath the jargon, every statement falls into one of two biological categories. You are either a Hawk or a Dove.​

    The Hawk

    A “Hawk” prioritizes controlling inflation. They view price stability as essential for long-term economic health.

    The Weapon: Their primary tool is Raising Interest Rates.

    The Effect: When rates rise, borrowing becomes expensive. Mortgages go up. Business loans go up. Spending slows down. The economy cools off.

    The Currency Impact: This is generally Bullish for the currency. Higher interest rates attract foreign investment looking for yield. If the US raises rates to 5 percent and Europe stays at 2 percent, investors may shift capital toward Dollar-denominated assets to access higher returns. The Dollar may strengthen..

    The Dove

    A “Dove” prioritizes economic growth and employment.. They may tolerate moderately higher inflation if it supports labor market stability..

    The Weapon:Their primary tools include lowering interest rates and, in certain environments, implementing measures such as Quantitative Easing.

    The Effect: Borrowing becomes cheap. Cash floods the system. Asset prices like stocks and houses tend to rise.

    The Currency Impact: This is generally Bearish for the currency. Lower rates make a currency less attractive to hold. Investors sell the currency to find better returns elsewhere. The currency weakens.

    The Pivot: One of the most closely watched developments in forex markets is a shift in policy stance. For example, when a previously hawkish central bank signals a more dovish approach, or vice versa. This is known as a “Policy Pivot.” Identifying such shifts early can offer strategic insight into potential trend changes, though confirmation and risk management remain essential..​

    Part 3: The Three Phases of a Policy Cycle

    Central banks do not change their minds overnight. They are large institutions that move in slow, deliberate cycles that can last for years. Understanding where you are in this cycle tells you the “bias” of the market. You want to be swimming with the current, not against it.​

    Phase 1: The Tightening Cycle (The Bull Run)

    Scenario: Inflation is rising. The economy is overheating. Everyone is spending money.

    Action: The Central Bank begins to raise interest rates. They might do it every meeting for a year.

    Market Reaction: Currencies may strengthen during sustained tightening cycles, particularly if interest rate differentials widen. Investor demand can increase due to higher yields.

    Trader Strategy: Traders often look for opportunities aligned with the prevailing rate trend while remaining attentive to changing data and sentiment..

    Example: The US Dollar in 2022 provides a notable  example. The Fed raised rates aggressively to fight inflation, and the Dollar crushed almost every other currency on the planet.

    Phase 2: The Pause (The Range)

    Scenario: Inflation is cooling but not dead. The economy is slowing but not crashing. The medicine is working but the patient isn’t fully cured.

    Action: The Central Bank stops raising rates and says “We will wait and see.” They hold rates at a high level.

    Market Reaction: Trend momentum may slow, and price action can become more range-bound as markets assess future direction. Volatility may decline compared to earlier phases..

    Trader Strategy: Range-based strategies may become more relevant in such environments, though breakout risks remain..

    Example: The transition period when the Fed holds rates at a “terminal level” before deciding their next move.

    Phase 3: The Easing Cycle (The Bear Market)

    Scenario: Recession hits. Unemployment spikes. Or perhaps inflation falls below the target and they are worried about deflation.

    Action: The Central Bank cuts rates to stimulate growth. They might cut fast and deep.

    Market Reaction: Currencies may face downward pressure during easing cycles, particularly if rate differentials narrow. Investor flows may shift toward higher-yielding alternatives..

    Trader Strategy: Some traders position for downside moves or reassess carry trade exposure, depending on broader risk sentiment.

    Example: The US Dollar in 2020. When the pandemic hit, the Fed slashed rates to zero to save the economy. The Dollar weakened significantly against assets like Gold and stocks.

    Part 4: Trading the “News” and Why It Is Dangerous

    Every six weeks or so, the Central Banks meet to announce their decision. These are the “Super Bowls” of the forex calendar. For the beginner, trading the actual news release is akin to running across a highway blindfolded. It is exciting, but the survival rate is low.

    The Volatility Spike: When the number is released, liquidity evaporates. The spread which is the cost to trade widens massively. Algorithms trading systems react in milliseconds.  Price can move sharply in both directions within seconds. This is called a “Whipsaw.” If you have a tight stop loss, it may be triggered quickly during such volatility. If risk is not properly managed, significant losses can occur..

    The “Priced In” Phenomenon: Beginners often lose money because they trade the headline.

    Headline: Fed raises rates by 0.25 percent.

    Beginner Thought: “Rate hike! Buy Dollar!”

    Market Reality: The market expected a 0.25 percent hike for weeks. It was already “priced in.” In fact, traders were secretly hoping for a 0.50 percent hike. The 0.25 percent is actually a disappointment.

    Result: The Dollar may weaken despite the rate hike, leading to confusion for traders focused only on the headline.

    Sophisticated Approach: Don’t trade the number. Trade the Forward Guidance. The decision is history. The market cares about the future. Read the statement. Listen to the press conference. Are they saying “We are done raising rates”? Or are they saying “We have more work to do”?

    If the Fed raises rates (a hawkish action) but signals concerns about economic weakness (a dovish tone), markets will weigh both elements. In many cases, forward-looking guidance can have a greater impact than the rate decision itself, though outcomes depend on broader positioning and expectations..​

    Part 5: Divergence is The Best Trade in the World

    If you only learn one strategy from this guide, let it be Policy Divergence.
    Currency pairs are a seesaw. If both sides are heavy because both Central Banks are Hawkish, the seesaw stays flat. It’s a boring and choppy market.
    But if one side is heavy and the other is light, you get a trend that can last for months.

    The Divergence Setup: Currency A (The Long): The Central Bank is raising rates. The economy is booming. Inflation is hot. Currency B (The Short): The Central Bank is cutting rates. The economy is in recession. Inflation is low.

    Example: USD/JPY in 2022

    • USA: The Fed was raising rates aggressively from 0 percent to 5 percent.
    • Japan: The BoJ kept rates at -0.1 percent using Yield Curve Control.

    The Result: The US Dollar exploded against the Yen. It moved from 115 to 150. It was the easiest trade on the board because the divergence was absolute. There was no guessing. The policy gap was widening every day. The fundamental driver was so strong that technical resistance levels were smashed like glass.​

    Part 6: The Risks and The “Don’t Fight the Fed” Rule

    There is an old Wall Street adage that says “Don’t Fight the Fed.” It suggests that traders should be cautious about positioning directly against a central bank’s clearly stated policy direction. . Central banks control monetary conditions and have significant influence over liquidity and interest rates. Competing against a strong policy trend can increase risk exposure..

    Intervention Risk: Sometimes, a currency moves too fast. The Central Bank gets angry. They step into the market and buy or sell their own currency to stabilize it. This is called “Intervention.” It happens without warning. It causes massive and violent reversals.

    • The Bank of Japan has historically intervened during periods of significant Yen weakness. For example, coordinated buying of Yen against the Dollar has at times resulted in abrupt multi-hundred pip movements within short timeframes.
    • The Lesson: When central bank officials state that they are monitoring foreign exchange developments closely, it may signal sensitivity to currency volatility. Traders should factor this into risk management and avoid excessive exposure during periods of elevated intervention risk

    The False Pivot: Sometimes the market thinks the Central Bank is going to pivot, but they don’t.
    The market rallies on hope. Then the Central Bank Chair comes out and says “We are not pivoting.” The market crashes. This happens often. Hope is a dangerous emotion in trading. Always wait for confirmation from the officials themselves rather than relying on the optimism of Twitter analysts.

    Part 7: A Practical Routine for the Beginner

    You do not need a Bloomberg terminal costing thousands of dollars a month to track Central Banks. You just need a routine and some discipline.

    1. The Economic Calendar: Every Sunday, look at the calendar for the week ahead.
    Mark the days with Central Bank rate decisions. Watch out for the Fed, ECB, BoJ, BoE, and RBA. Mark the speeches by Central Bank governors. When Jerome Powell or Christine Lagarde speaks, the market listens.

    Action: Consider reducing position size or adjusting risk exposure ahead of major announcements unless your strategy specifically accounts for high-volatility conditions and potential slippage..

    2. The Sentiment Check: Read the summaries of the last meeting. Is the bias Hawkish or Dovish?

    Action: If the Fed signals a hawkish stance, some traders look for setups aligned with potential Dollar strength. If the Fed signals a dovish stance, traders may evaluate scenarios consistent with Dollar weakness. Aligning with prevailing policy direction can reduce counter-trend exposure, though confirmation and risk controls remain essential.

    .

    3. The Reaction Wait: If a major decision happens at 2:00 PM, do not trade at 2:01 PM.

    Waiting for initial volatility to settle can provide clearer price structure. Institutional repositioning and liquidity normalization may take time. Subsequent moves often develop once the market has absorbed the information and volatility stabilizes.

    Part 8: The Psychology of the Central Bank Trader

    To trade this way requires a shift in mindset. You are no longer looking for patterns on a chart. You are looking for discrepancies in value. You have to think like a policymaker. If inflation is 8 percent, tightening policy may be a likely consideration..

    If market pricing diverges materially from likely policy outcomes, adjustments can occur as expectations evolve.Opportunities may arise from discrepancies between projected policy paths and prevailing market assumptions. 

    It also requires patience. Central bank trends are not scalping opportunities. They are trends that develop over weeks and months. You have to be willing to hold a position. You have to be willing to sit through pullbacks. You have to trust the fundamental thesis even when the 5 minute chart looks scary.

    The Long Game

    Forex trading is often sold as a game of technical analysis. You are told to look for lines on a chart, Fibonacci retracements, and moving averages. But those lines are just the footprints. The Central Banks are the ones making the footsteps. If the footprints lead off a cliff, it doesn’t matter what the RSI indicator says. You are going off the cliff.

    Navigating Central Bank shifts is not about predicting the future with a crystal ball. It is about listening to what the masters of the universe are telling you. When they say they are going to raise rates, believe them. When they say they are worried about the economy, believe them. When they say nothing, stay out of the market.

    The Central Banks provide the tide. You are just a surfer. You cannot control the ocean. You cannot tell the waves where to break. But if you learn to read the waves, you can have the ride of your life. And if you ignore the tide? Well, the ocean is a cold and unforgiving place for those who refuse to respect its power.

    The successful trader is the one who accepts their smallness in the face of these giants. They do not fight. They adhere. They follow. And in doing so, they profit from the movements of the leviathans.

    Final Reminder: Risk Never Sleeps

    Heads up: Trading is risky. This is only educational information, not investment advice.

  • The Week Ahead: Markets at a Pivotal Crossroads

    The Week Ahead: Markets at a Pivotal Crossroads

    A Synthesis of YWO Broker Contributor Analyst Fred Razak’s Weekly Forecast

    Navigating the Pivot: Consolidation and Catalysts A new trading week has begun, and the economic calendar is heating up. We are currently at a pivotal crossroads as markets enter what YWO Broker Contributor Analyst Fred Razak describes as critical “consolidation territory.”

    In his latest weekly breakdown, Razak explores the three primary themes set to define the days ahead: persistent U.S. Dollar weakness, a wave of high-impact central bank decisions, and a critical look at corporate health through major retail earnings. The overarching question for traders is whether recent market moves are merely a temporary bounce or the start of a sustained comeback.

    Based on Razak’s analysis, here are the key themes and technical setups to watch for the week of February 16th to 20th.

    1. The Macro Theme: Dollar Weakness and Policy Watch 

    The dominant narrative continues to be the persistent weakness of the U.S. Dollar. Razak highlights the Greenback’s struggle against major counterparts, specifically noting the potential for continued strength in the “Aussie” (AUD) and “Kiwi” (NZD). Traders must determine if we are due for a reversal or if the dollar’s downward trend will continue.

    This currency volatility will be tested by a slate of high-impact policy events:

    • Tuesday: Focus shifts to UK employment data and Canadian Core CPI.
    • Wednesday: A major day for policy watchers, featuring the RBNZ rate decision, UK CPI, and the release of the Fed (FOMC) minutes.
    • Friday: A final pulse check on global growth via Manufacturing and Services PMI data from Germany and the U.S.

    2. A Tale of Two Stocks: Walmart vs. Apple 

    In the equities sector, Razak points to a fascinating divergence between two market titans.

    • Walmart (WMT): Taking center stage on Thursday, the retail giant releases earnings while its stock is on a strong breakout to new record highs. It is being viewed by some analysts as a sign of retail resilience..
    • Apple (AAPL): In sharp contrast, Apple is currently testing key support levels following a significant pullback  from its 185 peak.

    Razak notes that international markets, including the Dow Jones, have seen only a slight bounce after recent sell-offs. The key question is whether this “bottoming out” will hold or whether further downside volatility could emerge.3. Commodities and Crypto: The Hunt for Momentum

    • Commodities: Gold is currently leading a metals comeback, while Crude Oil is holding at a critical support level. Razak suggests keeping a close watch on whether these support zones can trigger a broader reversal.
    • Crypto: The digital asset space is showing signs of life. Razak notes Bitcoin’s attempt to follow through on its move toward the $70k mark, but also highlights potential surprise recovery moves in altcoins like XRP and DOGE.

    Conclusion: The “Stepped” Pivot Fred Razak suggests that in this environment, markets may not pivot all at once but rather “in steps.” This requires traders to be highly selective and diligent, focusing only on assets that are truly moving rather than anticipating a uniform market recovery.

    Watch the Full Technical Breakdown 

    This summary only scratches the surface. For the full technical analysis, detailed price levels, and Fred’s broader market outlook, watch the complete video below

    Don’t go into the week uninformed — get the market context you need to stay aware of potential moves..

    The views expressed in this video are those of the speaker and are provided for general informational and educational purposes only. They do not constitute investment advice, a recommendation, or an offer to buy or sell any financial instrument.

    YWO (CM) Ltd does not guarantee the accuracy or completeness of the information presented. Market conditions can change rapidly. Trading Forex, CFDs, commodities, equities, and cryptocurrencies involves significant risk, particularly when leverage is used, and may not be suitable for all investors. You may lose part or all of your invested capital.

    Viewers are solely responsible for their trading decisions and should conduct independent research or seek professional advice where appropriate.

  • Trading Altcoins: Why Liquidity Matters More Than Hype

    Trading Altcoins: Why Liquidity Matters More Than Hype

    In the cryptocurrency ecosystem, hype is the loudest signal, but liquidity is one of the few factors that ultimately determines execution quality. Twitter (X) threads, YouTube thumbnails, and Telegram groups are designed to sell you a dream of 100x returns. They rarely mention the mechanical reality that undermines many altcoin traders: the inability to exit the trade when it matters.

    Altcoin trading is often presented as a game of picking winners. In reality, its also a matter of managing liquidity risk. A coin can go up 1,000% on paper, but if there is no one on the other side of the order book, realizing those gains may be difficult or materially impact price. In such cases, profits remain theoretical, particularly in thin markets.

    This guide explores why experienced traders often prioritize order book depth and trading volume over marketing narratives, and how you can avoid the “liquidity trap” — situations where limited market participation restricts efficient entry or exit — that affects many portfolios during speculative cycles.

    The Liquidity Illusion: Why “Market Cap” Lies

    Beginners often judge an altcoin by its Market Capitalization. They assume that a project with a $100 million market cap is “safe” or “established.” This can be a misleading assumption.

    Market Cap is calculated as: Circulating Supply × Last Traded Price.

    But that trade could have been for $10 worth of tokens. It does not mean there is $100 million of deployable capital actively supporting price levels. It also does not mean you can sell $1 million worth of tokens without significantly impacting the market price.

    True Liquidity is the depth of the order book. It is the amount of money waiting on the “Buy” side to absorb selling pressure.​ If you hold $10,000 worth of a low-cap altcoin, and the buy side of the order book only has $5,000 worth of bids within 10% of the current price, you may be unable to exit the full position near the quoted price without materially affecting its value. In such cases, liquidity constraints can become a practical limitation.

    The Cost of Illiquidity: Slippage

    Slippage is the difference between the price you see on the screen and the price you actually get. In liquid markets like Bitcoin or Ethereum, slippage is negligible (often 0.01%). In illiquid altcoin markets, slippage can become more pronounced.

    Imagine you try to sell a volatile AI token during a crash.

    • Screen Price: $1.00
    • Your Order: Sell 1,000 tokens.
    • Order Book: There are only 100 bids at $1.00. The next bids are at $0.90, then $0.80.
    • Execution: Your order sweeps the book. You sell some at $1.00, some at $0.90, some at $0.80.
    • Average Fill Price: $0.85.

    In this example, the average execution price is 15% below the quoted level, not necessarily because of broader market direction, but because of limited depth in the order book.

    High liquidity generally allows larger orders to be executed with less price disruption. Low liquidity increases the likelihood of unfavorable execution, particularly for larger orders relative to market depth.

    How to Spot a “Ghost Town” (Liquidity Checks)

    Before you buy any altcoin, you must perform a liquidity audit. Do not trust the chart. Trust the volume.

    1. Volume to Market Cap Ratio (The 10% Rule)

    Look at the 24-hour trading volume relative to the market cap. A trading pair is often considered more active when daily volume approaches a meaningful percentage of its market cap (for example, around 10%, depending on market conditions).

    • Market Cap: $10 million
    • Volume: $1 million (Relatively active)
    • Volume: $50,000 (Low activity / limited participation)

    Low volume relative to valuation means the price is supported by limited participation and may be more sensitive to large orders.

    2. The Bid-Ask Spread

    Go to the exchange and look at the order book. Calculate the difference between the highest Buy order and the lowest Sell order.

    • Tight Spread (Good): 0.1% to 0.5%. This often reflects stronger participation and market-making activity.
    • Wide Spread (Bad): 2% to 5%. This may indicate lower participation or thinner liquidity, meaning traders could experience greater execution costs.

    3. Exchange Listings

    Where is the token traded? If it is only on one obscure Decentralized Exchange (DEX) or a Tier-3 centralized exchange, liquidity may be fragmented or limited. If it is on Tier-1 exchanges (Binance, Coinbase, Kraken) ,often benefit from broader market participation and deeper aggregated liquidity, though liquidity conditions can still vary.

    The Exit Strategy: Liquidity Is Dynamic

    The most critical lesson in altcoin trading is this: Liquidity is not constant. It is dynamic. It often increases during periods of heightened interest and declines during risk-off conditions. When an altcoin is rallying strongly, participation may increase, making execution easier. When trends reverse, order book depth can contract, and bids may be withdrawn. The available exit liquidity can narrow significantly during periods of stress.

    Risk Management Insight: Many experienced traders aim to consider exit liquidity as part of their overall trade planning. Rather than reacting only after volatility increases, they may monitor liquidity conditions during strong price advances, when order book depth is typically greater.

    Exiting positions during sharp declines in thin markets can result in unfavorable execution, particularly if orders exceed available depth. In such conditions, traders may experience rapid price movement and inconsistent fills.

    .

    Trading Crypto CFDs: The Liquidity Hack

    For traders who want exposure to altcoin volatility without the risk of getting trapped in an illiquid order book, trading crypto CFDs may offer an alternative structure.

    When you trade a CFD on an altcoin (like Solana, Cardano, or Polkadot), you are trading with a broker, not directly on the blockchain order book.

    • Execution: The broker guarantees execution at the quoted price (subject to their terms). You are not dependent on finding a buyer in a decentralized pool.
    • Shorting: You can short illiquid altcoins just as easily as you buy them. In the spot market, shorting small caps is impossible. In the CFD market, it is a standard click.
    • Stability: Regulated brokers aggregate liquidity from multiple institutional sources, often providing tighter spreads and deeper books than the native on-chain markets for mid-cap tokens.

    However, remember that CFDs are designed for price-based trading, not long-term project participation. You do not own the underlying token, so you cannot stake it or participate in governance. For traders focused on short-term price movement, CFDs may reduce certain on-chain liquidity constraints, though they introduce counter-party and leverage risk.

    Conclusion: Liquidity Matters

    Hype gets you into the trade. Liquidity gets you out. Market losses are not limited to poor project selection. They can also result from timing, volatility, and insufficient exit liquidity during stressed conditions.

    Before you press buy, ask yourself: “If I need to leave this room in a panic, is the door big enough?” If the volume is low, the spread is wide, and the exchange is sketchy, liquidity risk may be elevated.

    Final Reminder: Risk Never Sleeps

    Heads up: Trading is risky. This is only educational information, not investment advice.

  • Leverage in Crypto: How to Manage Risk with High Volatility

    Leverage in Crypto: How to Manage Risk with High Volatility

    Leverage is the financial equivalent of handing a teenager the keys to a Ferrari, pointing them toward the Autobahn, and telling them to “have fun.” It is powerful, exhilarating, and without the right training, absolutely catastrophic.

    In the world of traditional finance, 2:1 leverage isoften viewed as relatively high. In the world of crypto, unregulated exchanges routinely offer substantially higher leverage, in certain cases 100:1, depending on jurisdiction and platform rules. This means with $100, you can control a position worth $10,000. It sounds like a shortcut to potential gains. In reality, it could also be  a shortcut to potential losses

    When leverage is applied to an asset class that can move sharply in a single day, it acts like a highly volatile substance — powerful when handled correctly, but dangerous without control. This guide is not about chasing quick profits; it focuses on managing risk and staying disciplined in high-volatility conditions.

    The Mechanics of the Trap

    To manage risk, you must first understand the mathematics of your own destruction. Leverage amplifies volatility. It compresses time.

    If you buy spot Bitcoin and it drops 10%, you have lost 10% of your equity. The position remains open, and recovery is still possible. If you buy Bitcoin with 10x leverage and it drops 10%, the loss may equal the full margin posted, triggering automatic position closure. In such cases, the exchange liquidates the position to limit further losses, potentially leaving little or no remaining equity.

    This threshold is commonly referred to as the liquidation level.” Every leveraged position has a price point at which margin requirements are no longer met and the position is closed.

    Illustratively:

    • At 5x leverage, a move of approximately 20% may exhaust posted margin.
    • At 20x leverage, a move of around 5% can have the same effect.
    • At 100x leverage, even a 1% price movement can materially impact margin.

    In crypto markets, price fluctuations of 1% or more can occur very quickly, particularly during periods of low liquidity or heightened volatility. As a result, higher leverage significantly increases the likelihood of liquidation over time if risk controls are not carefully applied.

    .

    Rule 1: Isolate Your Liability

    Exchanges offer two modes of margin: Cross Margin and Isolated Margin.
    Beginners often default to Cross Margin because it is flexible. However, this structure carries additional risk if not fully understood.

    Cross Margin: The exchange uses your entire account balance as collateral for your trade. If you have $10,000 in your account and you open a $1,000 trade that goes wrong, the exchange will drain the other $9,000 to keep the trade open. ​

    Isolated Margin: You allocate a specific amount of collateral to a single trade. If you put $100 into a trade, that is all you can lose. If the price crashes, the trade closes, you lose the $100, but the rest of your account is untouched.​

    Risk Management Insight: Many traders prefer isolated margin as a way to compartmentalize risk. By limiting exposure to a predefined amount per trade, it can help reduce the impact of execution errors, sudden volatility, or unexpected market events. While no margin system eliminates risk entirely, isolated margin can function as a practical risk-containment mechanism when used appropriately.

    Rule 2: Respect the Volatility Adjusted Position Size

    The most common question beginners ask is, “How much leverage should I use?” From a risk perspective, the leverage ratio alone is often less important than overall position size.

    To illustrate this concept, Consider two traders, each controlling a $10,000 Bitcoin position:

    • Trader A buys $10,000 of Bitcoin on the spot market.
      A 10% price decline results in a $1,000 loss, and the position remains open.
    • Trader B controls a $10,000 Bitcoin position using high leverage, posting a much smaller margin.
      While the price move is the same, the position may be liquidated well before a 10% decline, resulting in the loss of the posted margin.

    In both cases, the price exposure is identical, but the risk profile is very different. Higher leverage reduces the margin required, but increases the likelihood of forced liquidation during normal volatility.

    Risk Management Insight:: Rather than focusing solely on leverage levels, many traders define risk based on the maximum dollar amount they are prepared to lose on a single trade. For example,  If you have a $10,000 account and you want to risk 1% ($100) on a trade with a 5% stop loss, your position size should be $2,000.

    Whether you use 2x leverage (putting up $1,000 margin) or 20x leverage (putting up $100 margin) the intended risk profile remains similar, provided execution occurs as planned.

    It is important to note that in highly volatile markets, execution conditions can vary, and protective orders may not always fill at expected levels.

    Rule 3: The Stop Loss Myth (Slippage)

    In traditional markets, a Stop Loss is used as a primary risk-management tool. In crypto, however, their effectiveness can be reduced during periods of extreme volatility. During a flash crash, liquidity evaporates. The price might jump from $50,000 to $48,000 without trading at $49,000. If your stop loss was at $49,000, it might not trigger until $48,000. This phenomenon is called Slippage.

    When high leverage is involved, the impact of slippage can be magnified. For example, let’s imagine that  you are at 50x leverage. You have a stop loss to manage risk.  The market gaps 2% against you. Your stop loss triggers late. The 2% gap, multiplied by 50x leverage, is a 100% loss. You are liquidated even though you had a stop loss.​

    Risk Management Insight: Stop-loss orders are a risk-management tool, not a guarantee. Many experienced traders account for slippage risk by adjusting leverage and position size, so that the liquidation level is meaningfully separated from the intended stop-loss level. This additional buffer can help reduce the likelihood of forced liquidation during sudden price movements, though it cannot eliminate risk entirely.

    Rule 4: Beware the “Wick” Hunters

    Crypto exchanges are adversarial environments. On Unregulated exchanges, market structure and liquidity conditions can result in clustered liquidation levels. Often, you will see a “Long Wick”: price moves sharply 5% to hit a cluster of stop losses and liquidations, then instantly rebounds to the original price. The chart looks like a long needle. The price action was noise. But your position is gone.​

    If you place your stop loss at an obvious level (like exactly at the previous low), you may be more exposed to short-term volatility driven by large market participants.e.

    Risk Management Insight: Place stops at less-obvious levels where appropriate. Use “Mark Price” where available  for triggering stops rather than “Last Price”  to help reduce the likelihood of liquidation caused by temporary price dislocations or localized volatility on a single venue.

    Rule 5: The Cost of Holding (Funding Rates)

    Leverage is not free. You are borrowing capital. In the perpetual futures market (the most popular way to trade crypto leverage), this cost is called the Funding Rate. Every set funding interval (commonly 8 hours), traders may either pay or receive a funding fee, depending on market conditions.

    • If the market is bullish, “Longs pay Shorts.”
    • If the market is bearish, “Shorts pay Longs.”

    In a strong bull market, funding rates can hit 0.1% every 8 hours. That is 0.3% per day, or roughly 10% per month.  If a trader holds a highly leveraged long position over an extended period, a substantial portion of returns may be offset by funding costs alone.

    Risk Management Insight: Leverage is for trading, not investing. It is for capturing a move over hours or days. For longer holding periods, spot exposure may reduce ongoing costs, as it avoids recurring funding payments.

    Conclusion: The Survivor’s Mindset

    The graveyard of crypto traders is filled with people who were “right.” They were right about the direction (Bitcoin went up), but they were wrong about the vehicle. They used too much leverage, got liquidated on a 10% dip, and then watched from the sidelines as the price rocketed to the moon without them.

    Leverage is a tool for precision, not a shortcut.

    • Use it to hedge your portfolio without selling your coins.
    • Use it to short a bear market.
    • Use it to trade short term volatility with isolated risk.

    It is not designed to transform small balances into outsized returns overnight. Markets tend to penalize excessive risk-taking over time. In crypto, the objective is not rapid enrichment, but long-term capital preservation. Leverage demands discipline  and misusing it often carries consequences.

    .

    Final Reminder: Risk Never SleepsHeads up: Trading is risky. This is only educational information, not investment advice.

  • How to Short Crypto: Trading in Falling Markets

    How to Short Crypto: Trading in Falling Markets

    For the average investor, a market crash is a tragedy. Portfolios shrink, retirement plans are delayed, and the color red dominates the screen. For the professional trader, however, a crash is simply a “trend change.” In fact, because fear is a stronger emotion than greed, markets often fall faster than they rise. This makes short selling a commonly used strategy during downward trends, when applied with proper risk management.

    Shorting is the act of attempting to benefit from the decline of an asset’s price. When you short Bitcoin or Ethereum, you are taking a position that the price may go down. If it does, you make money. If it rises, you lose money.

    It sounds simple, but the mechanics of “selling what you do not own” can be confusing for beginners. This guide aims to explain the fundamentals of short selling, outline common ways traders execute short positions, and highlight key risks that should be understood before engaging in this type of trading.

    The Concept: How Can You Sell Nothing?

    To understand shorting, you have to separate the “asset” from the trading contract.

    In the traditional spot market (like buying physical gold), you cannot sell what you do not have. You must buy first, then sell later.
    In the shorting market, the process is reversed: You sell first, then buy later.

    Below is a simplified example of how a classic short trade works::

    1. Borrowing: You borrow 1 Bitcoin from a lender (usually your broker or exchange) when the price is $50,000.
    2. Selling: You immediately sell that borrowed Bitcoin on the market. You now have $50,000 in cash, but you owe 1 Bitcoin to the lender.​
    3. Waiting: The price of Bitcoin crashes to $40,000.
    4. Buying Back (Covering): You use $40,000 of your cash to buy 1 Bitcoin back from the market.
    5. Returning: You return the 1 Bitcoin to the lender to clear your debt.
    6. Profiting: You have $10,000 left over. This represents the outcome of the trade

    If the market moves in the opposite direction and prices rise, losses may increase accordingly.

    In modern trading, much of this happens automatically in the background. You just click “Sell,” and the platform handles the borrowing and selling instantly.

    3 Ways to Short Crypto

    There isn’t just one way to short. The method you choose depends on your risk tolerance, your jurisdiction, and whether you want to own coins or just trade prices.

    1. Crypto CFDs (Contract For Difference)

    This is the most direct route for traders in regulated jurisdictions (outside the US).

    • How it works: You don’t borrow or own any crypto. You agree to a contract with a broker to exchange the difference in price. If the market price falls, the position may generate a gain; if it rises, losses may occur..
    • Pros: Instant execution, no wallet needed, high leverage may be available depending on jurisdictions, and you are trading with a regulated entity.​
    • Cons: You don’t own the asset, and you may pay overnight financing fees (swap).

    2. Margin Trading on Spot Exchanges

    This is for traders who want to stay within the crypto ecosystem.

    • How it works: You use your existing crypto (like USDT or BTC) as collateral to borrow funds from the exchange. You then sell the borrowed coins.
    • Pros: You are trading on the actual order book.
    • Cons: You are exposed to “exchange risk” (hacking or insolvency). You also have to pay hourly interest on the borrowed coins.​

    3. Perpetual Futures (Perps)

    This is a widely used instrument among  professional crypto traders.

    • How it works: Similar to CFDs but native to crypto exchanges. You trade a contract that tracks the price of the underlying asset. These contracts have no expiry date, so you can hold them as long as you can pay the “funding rate.”
    • Pros: high market liquidity, high leverage (often 50x or 100x) depending on jurisdiction , and ability to stay anonymous on DEXs (Decentralized Exchanges).
    • Cons: Funding rates can be expensive if the market is crowded. Liquidation mechanisms can be rapid and result in significant losses

    Crypto CFD Strategies for Shorting

    Blindly shorting because “it went up too much” is widely considered high risk The market can remain volatile or trend irrationally for extended periods, making discipline and risk management essential. Below are commonly referenced technical approaches that traders use when analyzing potential short opportunities.

    The “Blow-Off Top” Fade

    Crypto markets are known for parabolic moves where prices go vertical. These moves are unsustainable and often end in a “blow-off top”—a sharp spike followed by a rapid rejection.

    • The Signal: Look for a vertical price candle on high volume that leaves a long “wick” at the top. This may indicate reduced buying momentum, though it does not guarantee a reversal..
    • The Trade: Enter a short position as the price breaks below the low of that rejection candle. Risk controls, including predefined exit levels, are typically used..​

    The Bear Flag Continuation

    Markets rarely move in a straight line. They drop, pause (consolidate), and then drop again. This pause is called a “Bear Flag.”

    • The Signal: After a sharp drop, price may move sideways or slightly higher, often with reduced trading activity. This can resemble a flag forming after a strong downward move..
    • The Trade: Wait for a confirmed break below the consolidation range before considering a short position, with confirmation and risk management playing a critical role.

    The Support Breakdown (Trend Reversal)

    This is one of the most widely referenced technical concepts in market analysis.

    • The Signal: Identify a major support level that has held the price up for weeks. WIf price closes decisively below this level, it can signal a potential shift in market sentiment..
    • The Trade: Short the retest. Often, price will break support, fall, and then bounce back up to “test” the old support level (which now acts as resistance). Entry timing and risk limits are key considerations..​

    The “Infinite Risk” Warning

    Short selling carries a different risk profile compared to buying.

    The amounts stated in the following lines, are for illustrative purposes only. 

    .

    • Long Risk: If you buy Bitcoin at $10,000, the worst case is it goes to $0. You lose 100% of your money. Your loss is capped.
    • Short Risk: If you short Bitcoin at $10,000, the price can go to $20,000, $50,000, or $1,000,000. There is no mathematical limit to how high a price can go. Therefore, your potential loss is theoretically infinite.​

    This is why Stop Losses are mandatory when shorting. You cannot just “hold and hope” like you can with a spot investment. If a short goes against you, you must cut it, or it will cut you.

    Hedging: Using Short Positions

    Not all shorting is aggressive speculation. Some traders use short positions as a hedging mechanism to offset potential downside risk in an existing portfolio..
    For example, an investor holding cryptocurrency long-term may believe prices could decline in the near term but prefer not to sell the underlying asset. By opening a short position of similar size, gains and losses may partially offset each other, helping reduce overall exposure to short-term price movements.

    Hedging strategies involve complexity and may not eliminate risk entirely.

    .​

    Conclusion

    Shorting crypto is the ultimate test of a trader’s skill. It requires fighting the natural optimism of the market and timing your entries with precision. For the beginner, short selling can carry elevated risk, while for more experienced participants, it can be one of several tools used to manage or express market views.. It means you no longer have to fear a bear market. Instead of dreading the crash, you can look at a sea of red candles and see an opportunity.

    Just remember: The bull walks up the stairs, but the bear jumps out the window. Shorting is fast, violent, and  may be also profitable, but only if you remember to bring a parachute (stop loss).

    Final Reminder: Risk Never Sleeps

    Heads up: Trading is risky. This is only educational information, not investment advice.

  • Buying Bitcoin vs. Trading Bitcoin CFDs: The Pros and Cons

    Buying Bitcoin vs. Trading Bitcoin CFDs: The Pros and Cons

    The choice between buying Bitcoin directly and trading Bitcoin CFDs is not just a technical decision; it is a lifestyle choice. It separates the “Holders” who view Bitcoin as a long term store of value from the active traders who view Bitcoin as a high velocity vehicle for extracting profit.

    Understanding the difference is critical because using the wrong vehicle for your goals can be costly. Holding a CFD for  extended periods can result in accumulating financing fees, while attempting very short-term trading in the spot market may involve execution constraints and operational risks, depending on the platform used..

    Here is the breakdown of the two paths.

    The Case for Buying Spot Bitcoin (The “Ownership” Route)

    Buying spot Bitcoin means you are exchanging fiat currency for digital property. The transaction is recorded on the blockchain, and you become the direct holder of the unspent transaction output (UTXO).

    Pros of Spot Bitcoin

    • True Ownership: You possess the asset. You can withdraw it to a hardware wallet, send it to a friend, or use it to buy goods. It is often described as censorship-resistant, with control determined by possession of the private keys..​
    • No Financing Costs: Once you pay the transaction fee, you can hold Bitcoin for an extended period of time without paying fees in maintenance or interest. This makes the spot ideal for long term investment strategies.​
    • Airdrops and Forks: If the Bitcoin network splits (forks) or if there are airdrops associated with holding the asset, spot owners may be eligible to receive the new tokens. CFD traders do not.​

    Cons of Spot Bitcoin

    • Custody Risk: “Not your keys, not your coins” implies a heavy responsibility. If you lose your private keys or your exchange gets hacked, it can result in permanent loss of access. . There is no customer service department for the blockchain.​
    • Capital Inefficiency: You must pay the full value of the Bitcoin upfront. If you want to buy $50,000 worth of Bitcoin, you need $50,000 in cash. There is no built in leverage.​
    • One Directional Bias: Spot trading is naturally bullish. Profiting from a price drop requires selling your holdings (moving to cash) or navigating complex borrowing mechanisms to short, which is difficult for beginners.​

    The Case for Trading Bitcoin CFDs (The “Speculation” Route)

    Trading crypto CFDs (Contracts for Difference) means you are entering a legal agreement with a broker to exchange the difference in Bitcoin’s price between your entry and exit. You never own the coin; you own the price exposure.

    Pros of Bitcoin CFDs

    • Leverage: CFDs allow you to trade large positions with a fraction of the capital. With 10:1 leverage, a $1,000 deposit lets you control $10,000 worth of Bitcoin. This amplifies potential gains..​
    • Easy Short Selling: Taking a bearish position can be done by opening a sell position, without owning or borrowing the underlying asset. This allows traders to hunt profits in both bull and bear markets with equal ease.​
    • Security and Simplicity: You trade on a licensed financial platform. There are no wallets to manage, no private keys to lose, and no risk of a “dust attack” on your address. Your funds typically sit in a segregated bank account.​

    Cons of Bitcoin CFDs

    • Overnight Financing (Swap): Because you are using leverage, you are effectively borrowing money from the broker. You pay interest (swap) on this loan every night. These fees compound and make CFDs unsuitable for long term holding.​
    • Lack of Ownership: You cannot withdraw your Bitcoin CFD to a wallet or use it to pay for anything. It is purely a financial settlement instrument.​
    • Leverage Risk: The same leverage that amplifies potential  gains also amplifies potential losses. A small price move against you can result in a “margin call,” liquidating your entire account instantly.​

    Summary Comparison

    The following table contrasts the key features of both methods.

    FeatureSpot BitcoinBitcoin CFD
    OwnershipYou own the digital asset (BTC) ​.You own a contract with the broker ​.
    LeverageTypically none (1:1), requiring full capital ​.Available (e.g., 2:1 to 30:1), requiring margin only ​.
    Short SellingDifficult; requires borrowing or selling existing holdings ​.Instant; native to the platform ​.
    Holding CostsNone; free to hold forever ​.Swap/Overnight fees charged daily ​.
    Security RiskWallet loss, hacking, private key mismanagement ​.Counterparty risk (broker solvency), margin liquidation ​.
    Best ForLong term investors (“HODLers”) ​.Short term traders and hedgers ​.

    Which Path Should You Choose?

    If your goal is to accumulate wealth over years and you believe in the fundamental value of Bitcoin, spot ownership is often considered more suitable. The absence of ongoing financing costs and the ability to hold the underlying asset can be advantageous over longer timeframes.​

    If your goal is to generate income this week from volatility, or if you want to hedge your long term portfolio against a crash,  CFDs may be used.  Features such as leverage and the ability to take short positions provide tools that are not available in spot-only trading, but come with higher risk..​

    Ultimately, many professional participants combine different approaches, such as holding spot assets for longer-term exposure while using CFDs for shorter-term trading or hedging activities. The appropriate choice depends on individual objectives, risk tolerance, and trading experience. 

    Final Reminder: Risk Never Sleeps

    Heads up: Trading is risky. This is only educational information, not investment advice.

  • Crypto CFD Trading: Profit from Volatility Without a Wallet

    Crypto CFD Trading: Profit from Volatility Without a Wallet

    For the first ten years of its existence, trading cryptocurrency felt less like sophisticated finance and more like a high stakes cyber-security drill. To participate in the digital gold rush, you had to become a part time IT specialist.

    You needed to generate seed phrases, purchase hardware wallets that looked like USB drives from 2005, and double check alphanumeric addresses to ensure you were not sending your life savings to a burning void. You lived in constant fear of phishing emails, dust attacks, and the terrifying realization that if you lost a scrap of paper with your private key on it, could result in permanent loss of funds.

    It was the financial equivalent of keeping your life savings in gold bars buried under the gazebo. Sure, it was secure from the banks, but it was incredibly inconvenient if you wanted to buy a sandwich or, more importantly, sell the top of a bubble.

    Enter Crypto CFD trading.

    CFD stands for Contract for Difference. It is a financial instrument that provides exposure to cryptocurrency price movements without requiring ownership of the underlying digital asset. It is the financial equivalent of renting a Ferrari for a track day instead of buying one. You get the speed, you get the adrenaline, and you get the performance, but you do not have to worry about changing the oil, storing it in a climate controlled garage, or wondering if someone is going to steal it while you sleep.

    For the modern trader, the shift from “holding coins” to “trading contracts” is a revelation. It reframes cryptocurrency from a technology-driven holding to a volatility-focused trading instrument, subject to market risk. It is a tool built not for the believers who want to dismantle the central banking system, but for the pragmatists who want to extract profit from the chaotic movement of digital asset prices.

    This comprehensive guide aims to explain the mechanics  of Crypto CFDs. It explores why they are commonly used for active trading, how they allow participation in both rising and falling markets, and the importance of managing leverage carefully, given its ability to amplify both gains and losses.

    Part 1: The Anatomy of a CFD (The Paper Bet)

    To understand why CFDs are widely used,, you must first understand what you are actually trading.

    When you buy Bitcoin on a traditional exchange like Coinbase or Binance, you are executing a spot transaction. You exchange fiat currency (Dollars, Euros) for digital currency. The blockchain records the transaction. You are now the legal owner of a specific unspent transaction output (UTXO) on the distributed ledger. You can send that Bitcoin to a friend in Tokyo, use it to buy a coffee in El Salvador, or hold it for ten years.

    When you trade a Bitcoin CFD, the process is different.

    A CFD is a derivative. It is a legally binding contract between you and a broker. The contract states that you will exchange the difference in the price of an asset from the point you open the trade to the point you close it.

    If you open a “Long” Bitcoin CFD at $90,000 and close it at $95,000, the broker pays you the $5,000 difference.
    If you open a “Long” Bitcoin CFD at $90,000 and the price drops to $85,000, you pay the broker the $5,000 difference.

    These examples are illustrative only.

    Notice what is missing from this equation. There is no blockchain. There are no miners. There is no gas fee. There is no wallet. There is only the price.

    This abstraction layer is  one reason CFDs are often considered operationally efficient.. Because you are not moving actual digital assets, the execution speed can be significantly faster, as trades are recorded on the broker’s systems rather than confirmed on a public blockchain.. You are simply updating a ledger on the broker’s server. In a market where prices can move 10 percent in ten minutes, that speed is not a luxury. It is a survival requirement.

    Part 2: The Wallet Problem (Why Custody Can Be Challenging))

    One commonly cited reason for trading CFDs is the operational complexity associated with custody.

    In the world of spot crypto, the mantra is “Not your keys, not your coins.” This is a valid philosophy for long-term holding and self-custody. For individuals who intend to hold Bitcoin for extended periods, managing private keys directly may be appropriate, depending on their objectives and risk tolerance..

    But for a trader? “Not your keys, not your coins” is a prison.

    Imagine a scenario where the market is crashing. It is a Sunday night. Bad news has just broken in Asia. Bitcoin is plummeting. You want to sell to protect your capital. But your Bitcoin is on a Ledger Nano X in a safety deposit box at the bank. Or it is in a cold storage wallet at your house, but you are on vacation in Bali.

    Even if you have the device with you, you have to plug it in, enter the pin code, initiate a transfer to an exchange, pay a high network fee to get priority processing, and wait for the blockchain to confirm the transaction. By the time your Bitcoin arrives at the exchange and is ready to sell, the price might have dropped another 5 percent.

    Now imagine the CFD trader in the same scenario.

    They see the market crashing. They open the app on their phone. They click “Sell.” The trade is executed in milliseconds. They have exited the market or flipped short to profit from the crash.

    For active trading, custody-related friction can be a factor.  Every step between you and liquidity is a leak where profit escapes. CFDs remove the friction. Your capital is held in fiat currency in a regulated bank account, ready to be deployed instantly. You never have to worry about a “dust attack” de-anonymizing your wallet. You never have to worry about losing your seed phrase in a boating accident. You outsource the security to a regulated financial institution and focus entirely on the chart.

    Part 3: The Mechanics of Leverage (The Force Multiplier)

    If speed is the first advantage of CFDs, leverage is the second.

    Leverage is the ability to control a large position with a small amount of capital. It functions as a financial multiplier, allowing market exposure that exceeds the initial deposit, while also increasing risk.

    In the spot market, if you want to buy 1 Bitcoin at $100,000, you need $100,000. This is a high barrier to entry. It means that to make meaningful money, you need meaningful capital. A 10 percent gain on a $1,000 investment is $100, which illustrates how returns scale with capital size.

    In the CFD market, you trade on margin. Margin is the good faith deposit you put down to open the trade. The broker lends you the rest.

    Let’s look at the math of a 10 to 1 leverage ratio. To open a position for 1 Bitcoin worth $100,000, you only need to deposit $10,000 (10 percent). The broker provides the other $90,000 through margin. 

    Now, let’s say Bitcoin rises by 5 percent to $105,000. Your position is now worth $105,000. You close the trade. You return the borrowed $90,000 to the broker. You keep your $10,000 margin. And you keep the $5,000 profit. On your initial deposit of $10,000, a $5,000 profit is a 50 percent return on equity. The asset moved 5 percent. You made 50 percent. That is the power of leverage. This example is for illustrative purposes only.

    However, leverage is a double edged sword. It cuts both ways with equal sharpness. If Bitcoin falls by 5 percent to $95,000, your position has lost $5,000. On your $10,000 deposit, that is a 50 percent loss. If Bitcoin falls by 10 percent to $90,000, your loss is $10,000. Your entire deposit is gone. You have been “liquidated.”

    This is why CFD trading requires careful risk management. Leverage amplifies both gains and losses, and relatively small price movements can have a disproportionate impact on account equity . The professional CFD trader treats leverage like handling radioactive material. Used correctly, it powers cities. Used incorrectly, it causes a meltdown.

    Part 4: The Art of Short Selling (Profiting from Gravity)

    Crypto markets are unique. They defy gravity for months, climbing higher on hype and hope, and then they obey gravity with brutal efficiency, crashing down in days. “The bull takes the stairs. The bear jumps out the window.”

    In the spot market, participating in downward price movements can be challenging. Investors typically need to sell holdings and hold cash, with the intention of re-entering at lower prices. . But you cannot make money while the price is falling unless you engage in complex borrowing schemes on decentralized finance protocols or centralized exchanges, which introduces counterparty risk.

    CFDs make short selling native. Shorting is simply the inverse of buying. You open a contract to sell the asset at the current price, with the intention of buying it back at a lower price in the future.

    When you click “Sell” on a CFD platform, you are entering a short position instantly. There is no borrowing of shares or coins involved on your end. The broker handles the hedging.

    This capability changes your relationship with the market cycle. For the spot investor (the “HODLer”), a bear market can be psychologically challenging. You watch portfolio values decline.. You post coping memes on social media about “diamond hands.” You wait for a reversal.

    For the CFD trader, a bear market may present trading opportunities.  Bear markets in crypto are often characterised by elevated volatility. Panic can drive sharper price movements than greed. . When support levels break, selling may accelerate. Being able to short allows participation across both rising and falling market conditions, rather than only periods of price appreciation. It allows traders to engage with volatility as a tradable feature, subject to risk.

    Part 5: The Costs of Business (The Hidden Friction)

    There is no such thing as a free lunch in finance. The convenience, speed, and leverage of CFDs come with a specific cost structure that every trader must understand. If you ignore these costs, they can gradually erode your account, like a hole in the bottom of a bucket.

    The Spread

    CFD brokers rarely charge a commission (a flat fee per trade). Instead, they make their money on the spread. The spread is the difference between the Buy price (Ask) and the Sell price (Bid).
    If Bitcoin is trading at $50,000, the broker might offer to sell it to you at $50,050 and buy it from you at $49,950.

    The $100 difference is the spread. This means that the moment you open a trade, you are instantly in a loss equal to the spread. The market must move in your favor just to break even.
    In times of high liquidity, spreads are tight. In times of panic, spreads widen. A professional trader always checks the spread before executing, ensuring it doesn’t eat too much of the potential profit.

    The Swap (Overnight Financing)

    This is the cost that catches most beginners off guard. Because you are trading on margin (using leverage), you are effectively borrowing money from the broker to hold your position.
    Like any financing arrangement, a cost may apply. This cost is charged every night that you hold the position open past a certain time (usually 5 PM New York time). This is called the Swap rate.
    For crypto CFDs, the swap rates can be significant. Crypto is a volatile asset class, and the cost of lending capital against it is high.

    If you are a day trader who opens and closes positions within the same day, you generally do not incur swap charges.

    If you are a swing trader holding positions for weeks, the swap fees can accumulate over time..
    If you hold a Short position, you might sometimes receive a swap payment (depending on interest rate differentials), but usually, you are paying to play.

    This structural cost makes CFDs generally less suited for long-term holding.. If you want to hold Bitcoin for five years, spot ownership is often discussed as more appropriate. If you want to trade it over shorter time horizons, CFDs are commonly used, subject to risk.

    Part 6: Strategy – The Hedging Masterclass

    One of the most sophisticated uses of Crypto CFDs is not speculation, but risk management.. This is known as hedging.

    Let’s assume you are a long term believer in Ethereum. You have accumulated 100 ETH over the years. You keep them in cold storage. You believe ETH will be worth $10,000 one day.
    However, the charts don’t look good right now. A recession is looming. You think ETH might drop 30 percent in the next month before recovering.

    You have two choices:

    1. Sell your ETH: You move it to an exchange, sell it for stablecoins, and may trigger a taxable event (Capital Gains Tax). Then you try to time the bottom to buy it back. This is stressful and tax inefficient.
    2. Hedge with a CFD: You leave your physical ETH exactly where it is. You open a brokerage account and open a Short ETH CFD position equivalent to the size of your holdings (or a portion of them).

    Now you are “Delta Neutral.” If ETH drops 30 percent, the value of your physical holdings falls, while the CFD short position may increase in value, partially or fully offsetting the loss, depending on execution, costs, and position sizing.

    Once downside pressure subsides and market conditions change, you close the CFD short position. Any resulting cash balance reflects the outcome of the hedge. You continue to hold your ETH throughout the period, without needing to sell the underlying asset.

    This approach is commonly used as a hedging technique to manage short-term risk. Similar principles are applied in traditional markets, such as commodities and energy, where derivatives are used to manage price exposure. With CFDs, a comparable framework can be applied to digital asset portfolios, subject to risk and product suitability.

    Part 7: Regulatory Safety vs. The Wild West

    The collapse of FTX, Celsius, and BlockFi taught the market a brutal lesson regarding counterparty risk. Unregulated, offshore crypto exchanges are black boxes. You do not know if they actually have your money. 

    Crypto CFDs are offered by Forex and multi-asset brokers operating under a range of regulatory frameworks, depending on jurisdiction.

    Regulatory requirements vary by jurisdiction but commonly include measures such as:

    Client Fund Segregation: Many regulators require brokers to hold client funds separately from operational funds, in accordance with applicable regulatory standards.

    Capital Requirements: Licensed firms are typically subject to minimum capital requirements intended to support operational resilience.

    Dispute Resolution and Oversight: Depending on the regulatory framework, formal complaint procedures and supervisory mechanisms may apply.

    Both spot crypto trading and CFD trading can be conducted through entities operating under different regulatory regimes. For market participants, the key consideration is understanding which regulatory framework applies, what protections are in place, and how client funds and risk are managed within that structure.

    Part 8: Who Should Trade Crypto CFDs?

    So, is this product for you?

    The Crypto CFD is built for:

    • The Day Trader: You want to get in and out quickly. You care about execution speed and tight spreads. You never hold positions overnight.
    • The Bear: You believe prices are going down and want an easy way to short the market without complex borrowing.
    • The Pragmatist: You don’t care about the technology or the ideology. You just want to trade price action on a regulated platform.
    • The Small Account: You want to use leverage to grow a small deposit (accepting the higher risk).

    The Crypto CFD is NOT for:

    • The HODLer: You want to buy and forget for ten years. Ongoing financing costs can make CFDs less suitable for long-term holding.
    • The Purist: You want to use crypto to pay for things or participate in DeFi protocols. You cannot withdraw a CFD to a wallet. It is cash settled only.
    • The Yield Farmer: You want to earn staking rewards or yield. CFDs do not pay staking rewards.

    Conclusion: The Instrument of the Mercenary

    In the end, Crypto CFD trading is a tool designed for active market participation, not long-term ownership. It is an instrument stripped of ideology, focused solely on price movement..

    It acknowledges a simple truth: You do not need to own the barrel of oil to profit from the price of oil. You do not need to own the gold bar to profit from the price of gold. And you do not need to own the private key to profit from the price of Bitcoin.

    By removing the wallet, you remove the friction. You trade faster, sharper, and with more tools at your disposal. You trade with the ability to profit from the collapse just as easily as the surge.

    Just remember that you have traded one risk for another. You have traded the risk of custody for the risk of leverage. The wallet cannot lose your money, but the margin call can. Respect the instrument, manage your size, and enjoy the speed of the ride.

    Final Reminder: Risk Never Sleeps

    Heads up: Trading is risky. This is only educational information, not investment advice.

  • Correlations: Does Gold Still Move Opposite to the Dollar?

    Correlations: Does Gold Still Move Opposite to the Dollar?

    In the old textbooks of financial history, the relationship between Gold and the US Dollar was simple. They were the Montagues and Capulets of the market.

    When the Dollar went up, Gold went down. When the Dollar went down, Gold went up. It was a clean, inverse correlation that allowed traders to sleep soundly at night, confident that the laws of financial physics were intact.

    Welcome to 2026. The textbooks are being rewritten, or at least heavily annotated with confused margin notes.

    The once-reliable inverse relationship between the yellow metal and the greenback is fracturing. We are seeing days, weeks, and even months where both assets rise in tandem, holding hands as they climb the wall of worry. For the sophisticated trader, this is either a nightmare or the greatest opportunity of the decade.

    Understanding why this divorce is happening, and when they might reconcile, is the key to unlocking the gold market in 2026. This article dissects the new correlation regime and what it means for your portfolio.

    The Traditional Logic: Why They Hated Each Other

    To understand the breakup, we must understand the marriage.

    Historically, Gold is priced in US Dollars (XAU/USD). This created a mechanical seesaw effect.

    1. The Denomination Effect: If the value of the Dollar falls, you need more Dollars to buy the same ounce of Gold. Mathematically, the price of Gold rises.
    2. The Opportunity Cost: A strong Dollar usually implies high US interest rates. High rates make bonds attractive and Gold (which yields zero) unattractive. Capital flows out of Gold and into Dollar-denominated assets.

    For forty years, this logic held. The correlation coefficient was consistently negative, often hovering between -0.5 and -0.8. If you were long Gold, you were implicitly short the Dollar.

    The 2026 Anomaly: The “Fear Trade” Unifies Them

    So, what changed? Why are we seeing periods where both assets rally together?

    The answer lies in the changing nature of global risk. In 2026, we are witnessing the rise of the “Polycrisis”, a convergence of geopolitical fragmentation, fiscal instability, and systemic distrust.​

    In a normal risk-off environment (like a recession scare), investors buy US Treasuries, boosting the Dollar. Gold might rise a bit, but the Dollar acts as the primary safe haven.

    But in a systemic risk environment (like a fear of global war or a US debt spiral), the rules change.

    • Investors buy the Dollar because it is still the cleanest shirt in the dirty laundry pile of fiat currencies. It offers liquidity and yield.
    • Central Banks buy Gold because they don’t trust the Dollar’s weaponization via sanctions. They want a neutral reserve asset that cannot be frozen by a swift kick from the US Treasury.​

    This creates a unique scenario where the Dollar strengthens against other currencies (like the Euro or Yen) due to relatively higher US rates, while Gold strengthens against everything(including the Dollar) due to sovereign demand.

    The correlation is no longer just about interest rates. It is about sovereign preference.

    The De-Dollarization Factor: A Structural Shift

    The “De-Dollarization” narrative has graduated from internet conspiracy theories to central bank policy meetings. Major economies, particularly in the Global South, are actively diversifying their reserves away from US Treasuries.​

    They are not selling Dollars to buy Euros. They are selling Dollars to buy Gold.

    This creates a persistent, price-insensitive bid for Gold that operates independently of the DXY (Dollar Index). Even if the Dollar rallies on strong US economic data, these central banks keep buying Gold on the dip. They are not trading the Fed pivot: they are trading a geopolitical pivot.

    This structural demand acts as a floor for Gold prices, dampening the downside even when the Dollar is tearing higher. It explains why Gold has remained resilient even during periods of “higher for longer” interest rates that should have theoretically crushed it.​

    The “Fiscal Dominance” Theory

    Another force breaking the correlation is the US fiscal situation.

    The US government is running deficits that are historically unprecedented outside of major wars. The bond market is starting to demand a higher “term premium” to hold long-term US debt.​

    In this environment, we see a strange phenomenon: US yields rise (normally bad for Gold), but Gold rises anyway.

    Why? Because the market interprets rising yields not as a sign of a strong economy, but as a sign of fiscal stress. Investors worry that the Fed will eventually be forced to monetize the debt (print money to buy bonds) to prevent a solvency crisis.

    This is called “Fiscal Dominance.” In this regime, Gold becomes a hedge against the debasement of the currency, regardless of what the nominal interest rate is. The Dollar might look strong against the Euro (which has its own problems), but it looks weak against real assets.

    When the Correlation Returns: The “Normalcy” Trap

    Does this mean the inverse relationship is dead forever? No.

    Markets are mean-reverting. The current decoupling is driven by specific stressors. If those stressors fade, the old correlation will likely reassert itself.

    Scenario A: The Soft Landing Success
    If the global economy stabilizes, geopolitical tensions cool, and the US fixes its fiscal trajectory (unlikely, but possible), the fear premium will evaporate. In this “normal” world, real interest rates will once again become the dominant driver. If the Dollar rallies on growth, Gold will fall. The seesaw will work again.

    Scenario B: The Deflationary Shock
    If we hit a hard recession, demand for commodities (including Gold) could collapse, while the Dollar spikes on a liquidity scramble. In a true deflationary bust, cash is king. Gold might initially fall with everything else before rebounding.

    How to Trade the New Regime

    For the trader, this broken correlation requires a new playbook. You cannot simply look at the DXY chart and place a trade on XAUUSD.

    1. Watch Real Yields, Not Just the Dollar
    The correlation between Gold and Real Yields (nominal rates minus inflation) is still tighter than the correlation with the Dollar. If real yields are falling, Gold can rally even if the Dollar is flat or rising. Use the TIPS (Treasury Inflation-Protected Securities) market as your true north.​

    2. The “Cross-Currency” Gold Trade
    If the Dollar and Gold are both strong, the smartest trade might not be XAU/USD. It might be XAU/EUR (Gold in Euros) or XAU/JPY (Gold in Yen).

    • If the Dollar is up and Gold is up, that means Gold priced in weaker currencies is exploding higher. Trading Gold against a weak currency (like the Yen in 2026) can offer a smoother, more powerful trend than fighting the Dollar.​

    3. Respect the Divergence
    When you see Gold and the Dollar rising together, do not blindly short Gold assuming it “must” come down. This divergence is a signal of extreme systemic stress. It is often a precursor to a major volatility event. It means the market is buying “insurance” in all forms. Respect the momentum.

    Conclusion: The Era of Complexity

    The simple days of “Dollar Up, Gold Down” are on pause. We are in an era of complexity, where sovereign demand, fiscal fears, and geopolitical fracturing are distorting the traditional signals.

    Gold is proving that it is not just the “Anti-Dollar.” It is the “Anti-Chaos.”

    In 2026, the Dollar can be strong because the US economy is outperforming Europe. And Gold can be strong because the world doesn’t trust the US government’s credit card bill. Both can be true at the same time.

    For the modern trader, recognizing this nuance is the difference between getting chopped up by the noise and profiting from the signal. Don’t trade the textbook. Trade the market in front of you.

    Final Reminder: Risk Never Sleeps

    Heads up: Trading is risky. This is only educational information, not investment advice.

  • What Drives Gold Prices? 5 Geopolitical Factors Watching Now

    What Drives Gold Prices? 5 Geopolitical Factors Watching Now

    Gold doesn’t pay a dividend. It doesn’t have earnings calls where a CEO in a Patagonia vest talks about “synergies.” It doesn’t even rust. It just sits there, judging the world.

    And right now, the judgment is harsh.

    For the modern trader, understanding what drives gold prices is less about studying supply and demand charts (though those matter) and more about becoming an amateur geopolitical analyst. Gold is the world’s “fear gauge,” but it’s a specific kind of fear. It’s not the “I lost my wallet” fear: it’s the “I think the currency system might need a reboot” fear.

    In 2026, the drivers of gold appear to be evolving. The old rules, like “strong dollar equals weak gold”, do not always hold consistently. The new rules are being written in embassy backrooms and central bank vaults.

    If you are navigating the markets, including through educational trading resources, here are five geopolitical factors currently influencing gold price behavior.

    1. The “De-Dollarization” Grudge Match

    For decades, the US Dollar has been the dominant reserve currency globally. It was the currency you used to buy oil, issue debt, and generally conduct civilization. However, its position is increasingly being questioned, and alternative arrangements are gaining attention.

    The narrative of “de-dollarization” has moved from the fringes of the internet to mainstream discussion in f global finance. It’s not that the Dollar is going to disappear next Tuesday. It’s that major economies, specifically the BRICS bloc (Brazil, Russia, India, China, South Africa), are exploring ways to reduce reliance on the US Dollar by developing parallel mechanisms.

    Why does this matter for gold? Because gold is often viewed as a neutral reserve asset. You can sanction a Dollar. You can freeze a Euro. But you can’t remotely turn off a gold bar sitting in a vault in Shanghai.

    The Watch: Pay attention to trade settlements. When Saudi Arabia accepts Yuan for oil, or India pays for Russian energy in Rupees, that may reduce marginal demand for the US Dollar and can support interest in alternative reserve assets such as gold. These developments may signal shifts in how central banks diversify reserves, as some institutions seek assets that are less exposed to geopolitical constraints.

    .​

    2. The Central Bank Buying Spree (The Whale in the Room)

    If you want to understand institutional reserve trends, don’t look only at short-term market commentary. Look at what central banks are doing with their reserves.

    For the last few years, central banks have been buying gold at a pace not seen since the 1960s. This appears to reflect longer-term reserve management decisions rather than short-term trading activity. Countries like China, Poland, and Singapore have increased gold allocations while adjusting exposure to other reserve assets, including government bonds.

    This creates a “price floor” for gold. In the stock market, there is a concept called the “Fed Put”—the idea that the Federal Reserve will step in to save the market if it crashes. In the gold market, we now have the “Central Bank Put.” Every time the price dips, a sovereign nation steps in to buy the discount , though no price level is guaranteed.

    The Watch: Keep an eye on the monthly World Gold Council reports. If central bank buying slows down, the gold could be affected. C. But as long as these “whales” continue to accumulate, it remains challenging for bearish gold narratives to gain traction.

    3. The “Weaponization” of Finance

    We live in an era where finance is increasingly influenced by geopolitical considerations. Sanctions have become a prominent policy tool.

    When the G7 froze Russia’s foreign reserves in 2022, it prompted reassessment across many governments, particularly in emerging and developing economies. The event highlighted that access to reserve assets can be affected by geopolitical alignment.

    For countries that may face future geopolitical disputes, this has reinforced the importance of holding assets with reduced counterparty exposure. Gold is often cited in this context due to its physical nature and independence from issuing authorities.

    This geopolitical friction can contribute to a “risk premium” to the price of gold. In a peaceful, globalized world, gold should trade at a discount because it yields nothing. In a fractured, suspicious world, gold trades at a premium because it is the only asset that is truly yours.​

    The Watch: Any escalation in sanctions regimes, may influence demand for alternative reserve assets, including gold. Such developments are often considered when assessing the relative risks of holding fiat-denominated reserves.

    4. The Fiscal Deficit (The Elephant in the Treasury)

    Geopolitics isn’t just about foreign wars: it’s also about domestic stability. And the US fiscal situation has drawn increasing attention from market participants.

    The US government is running large and persistent fiscal deficits, with significant levels of new debt issuance even during periods of economic expansion and relatively strong employment. This scale and timing of deficit spending is viewed by many analysts as unusual in a historical context.

    The bond market has shown sensitivity to these dynamics . This is why we see “Term Premium” rising: investors may demand higher interest rates to hold long-term US debt.

    Gold is often discussed as a hedge during periods of fiscal stress.  When a government borrows more than it can ever realistically pay back in real terms, concerns around currency debasement and inflation expectations may increase. In that context, gold’s limited supply and non-sovereign nature are commonly cited as factors that can help preserve purchasing power over time.​

    The Watch: Watch the US Treasury auctions. If demand for US debt weakens (a “failed auction”), yields could rise, and the Dollar may experience increased volatility. Such conditions are frequently observed by market participants when assessing gold’s relative attractiveness.

    5. The Hot Wars (and the Cold Ones)

    Finally, there is the old-fashioned kinetic war driver.

    Conflict in the Middle East and Eastern Europe has a notable influence  on gold prices. The Middle East is crucial not just for oil, but for shipping routes. Disruption there may cause inflation (energy prices spike), which is good for gold.​

    But be careful. Gold tends to react to the threat of war more than the war itself. It’s the “fear premium.” Once the missiles start flying, the market often sells the news.

    Current conflicts have a different character, as they involve broader geopolitical alignments and the indirect involvement of major powers. This has increased attention on so-called “tail risks,” referring to low-probability but high-impact outcomes. Gold is frequently discussed in this context as a potential hedge against such extreme scenarios.

    The Watch: Don’t just watch the headlines, watch the energy markets. Spikes in oil prices linked to geopolitical tension can coincide with increased interest in gold, as both markets often reflect shifts in inflation expectations.

    Conclusion: The New Gold Standard

    So, what drives gold prices in 2026? It’s not just interest rates anymore. It’s the slow, grinding tectonic shift of the global order,that market participants increasingly discuss.

    It’s the realization that the system built in 1945, with the Dollar at the center, is being reassessed and may be evolving at the margins.

    For the trader, this means that gold is no longer just a trade: it’s a macro position. It’s a reflection of complexity. It’s a reflection of friction.

    If you are using a gold trading guide, look for the sections on correlation. Notice how gold is at times observed to decouple from real rates? That’s what some analysts describe as a geopolitical premium influencing pricing.

    The world is getting messier. And messiness, historically, has often coincided with increased attention on gold.

    Final Reminder: Risk Never Sleeps

    Heads up: Trading is risky. This is only educational information, not investment advice.

  • XAUUSD vs. Physical Gold: Which is Better for Traders?

    XAUUSD vs. Physical Gold: Which is Better for Traders?

    Gold is a strange asset. It is a chemical element, a monetary standard, a jewelry component, and a fear index, all rolled into one shiny package.

    When you decide to “trade gold,” you are immediately faced with a structural decision that can influence your overall approach: Do you want to trade the idea of gold, or do you want to trade the object of gold?

    This is the battle between XAUUSD (Spot Gold) and Physical Gold.

    Most novices assume these are just two ways of doing the same thing. That’s not exactly the case. They are two completely different sports, played on different fields, with different rules, costs, and tax implications.

    Choosing the wrong one is like bringing a golf club to a tennis match. You might technically be swinging at a ball, but the tool may not be appropriate for the objective.

    This guide breaks down the mechanics, the mathematics, and the mindset required for each, so you can decide which weapon belongs in your arsenal when trading gold online.

    The Contenders: Defining the Terms

    Before we draw comparisons, let’s define the two approaches.

    Physical Gold is exactly what it sounds like. It is bullion. It is coins, bars, and ingots that you can hold in your hand, drop on your foot (painfully), and bury in your backyard. When you buy it, you own it. It is an asset withlimited counterparty risk, subject to storage and security considerations.

    XAUUSD is a financial derivative. It is a contract that tracks the price of one troy ounce of gold in US Dollars. When you trade XAUUSD on a Forex platform, you do not own any metal. You own a digital entry in a database that says you are “long” or “short” exposure.  You are trading price action, not molecules.

    Round 1: Liquidity and Speed (The Trader’s Oxygen)

    If you are a trader, someone who seeks to benefit from price movements over minutes, hours, or days, liquidity is your oxygen. Without it, you may be exposed to wide spreads and slippage.

    XAUUSD typically demonstrates higher liquidity. It is among the more liquid gold-related markets globally. Positions of significant size can generally be opened and closed quickly during market hours. The spread (the difference between the buy and sell price) is often relatively narrow, which can support short-term trading strategies such as scalping.

    Physical Gold is the opposite. It is illiquid. You cannot sell a gold bar at 3:00 AM on a Tuesday. To sell physical gold, you have to find a dealer, ship the metal (or walk into a shop), get it assayed (tested for purity), and accept the dealer’s “bid” price, which is often significantly lower than the spot price. The “spread” on physical gold—the difference between what you pay to buy it can be materially wider, often depending on form, market conditions, and dealer pricing.

    The Verdict: If your objective is frequent entry and exit, Physical Gold is generally less suited to short-term trading activity, while XAUUSD is commonly used for this purpose.

    Round 2: The Cost of Carry (The Hidden Tax)

    Here is where the math gets interesting.

    Physical Gold has a “negative carry” in the real world. You have to pay for shipping, insurance, and storage. If you keep it at home, you need a safe. If you keep it in a vault, you pay fees. However, once you own it, it does not cost you anything to hold it in terms of interest. It sits there, costing you primarily storage-related expenses and security considerations.

    XAUUSD has a “negative carry” in the financial world. Because you are trading on margin (leverage), you are effectively borrowing money to open the position. If you hold a long position overnight, the broker charges you a “Swap” or “Rollover” fee. In a high-interest-rate environment, these fees may increase. If you hold a large XAUUSD position for an extended period, swap fees can materially impact overall performance.

    The Verdict: For short-term trades (intraday to a few weeks), XAUUSD may involve lower holding costs. For long-term holding (years or decades), Physical Gold may involve fewer ongoing financing costs, as it avoids recurring swap charges.

    Round 3: Leverage (The Double-Edged Sword)

    Leverage is the ability to control a large position with a small amount of capital. It is one of the primary features of  retail traders to the Forex market.

    XAUUSD offers leverage. Depending on your jurisdiction and broker,  leverage levels may vary, such as 20:1 or 50:1. For example, with $1,000 in your account, you can control $50,000 worth of gold. If gold moves up 1%, your account grows by 50%. If it moves down 1%, your account drops by 50%.​

    Physical Gold has zero leverage (unless you take out a loan to buy it, which is generally not a good  idea). You pay 100% of the value upfront. If you have $1,000, you buy $1,000 worth of gold.

    The Verdict: Leverage can amplify both gains and losses and therefore requires careful risk management. XAUUSD provides access to leveraged exposure, while Physical Gold limits exposure to the capital invested.

    Round 4: Counterparty Risk (The Apocalypse Scenario)

    Why do people buy gold? Often, it is because they seek protection against bank failures, currency instability, or electronic disruptions.

    XAUUSD is dependent on multiple intermediaries. You are relying on your broker’s solvency, the liquidity provider’s stability, and the internet connection. If your broker were to fail, access to positions could be affected, as XAUUSD represents a financial claim rather than physical ownership.

    Physical Gold does not rely on a financial intermediary once in your possession. If the power grid goes down, the banks close, and the internet breaks, your gold coin is still in your hand. For this reason, it is often viewed as an offline store of value.

    The Verdict: For short-term trading activity, counterparty risk may be a secondary consideration. For individuals seeking portfolio diversification or contingency planning, physical gold is often cited as a hedge against systemic disruptions.

    Round 5: Tax Considerations

    This is the part that determines after-tax outcomes, and it varies significantly by jurisdiction.

    Physical Gold in the US is often taxed as a “collectible,” which carries a higher maximum capital gains tax rate (currently up to 28%). It doesn’t matter if it’s a coin or a bar; the IRS sees it as a collection of stamps or art.​

    XAUUSD taxation depends heavily on where you live and how you trade. In some jurisdictions, it is taxed as standard income. In others (like the UK with spread betting), it might be tax-free. In the US, Forex trading often falls under Section 988, meaning gains are treated as ordinary income, while losses may be deductible subject to applicable rules.

    The Verdict: It’s messy.  Short-term traders may prefer derivative instruments due to reporting structures, while long-term physical holders should consider the impact of collectible tax treatment where applicable.

    The Strategy: Who Should Choose What?

    Now that we have analyzed the rounds, here is the decision matrix.

    Choose XAUUSD If:

    1. You are a Scalper or Day Trader: You need tight spreads and instant execution. You are in and out in minutes. Physical gold is impossible for this.
    2. You Have a Small Account: You want to trade gold price movements but only have lets say $500. Leverage can allow participation with smaller capital.
    3. You Want to Short Gold: You think gold prices are going down. You can click “Sell” on XAUUSD just as easily as “Buy.” You cannot easily “short” physical gold without a complex lending arrangement.
    4. You are Hedging: You own physical gold but think the price will drop next week. You can short XAUUSD to offset the loss in your physical holdings without selling them.

    Choose Physical Gold If:

    1. You are an Investor, Not a Trader: You plan to hold for 5, 10, or 20 years. You want to pass wealth to your children.
    2. You Are Concerned About Systemic Risk: You prefer an asset with no direct reliance on financial intermediaries and reduced exposure to counterparty risk.
    3. You Prefer Fewer Ongoing Fees: You want to avoid recurring swap or financing charges and accept upfront dealer premiums and storage costs instead.

    Conclusion: The Right Tool for the Job

    The debate between XAUUSD and Physical Gold is not about which is “better.” It is about time horizon and intent.

    Trading gold online via XAUUSD is  commonly used as a short-term trading approach that provides exposure to price volatility. It is an active trading activity.

    Buying Physical Gold is often viewed as a long-term wealth preservation approach. It is a way to hold value outside the financial system.

    The sophisticated operator does both. They trade XAUUSD to seek benefits, and they may use a portion of those benefits to buy Physical Gold as a permanent store of value. This approach blends active market participation with longer-term value storage.

    Final Reminder: Risk Never Sleeps

    Heads up: Trading is risky. This is only educational information, not investment advice.