Category: Trading Strategy

  • Understanding Market Indicators: The Top 7 Tools for Smarter Trading Decisions

    Understanding Market Indicators: The Top 7 Tools for Smarter Trading Decisions

    Charts are messy. A raw price chart is just a jagged line of human emotion: greed, fear, and panic plotted against time. To make sense of it, traders use indicators. These are mathematical formulas applied to price and volume data, designed to smooth out the noise and reveal the “truth.”

    Or at least, that is the sales pitch.

    In reality, most indicators are lagging. They tell you what just happened, not what is about to happen. A chart with twenty indicators on it is not a sign of a sophisticated trader; it is a sign of a confused one. The goal is not to find a magic crystal ball. It is to find a few reliable tools that help you frame the market’s behavior.

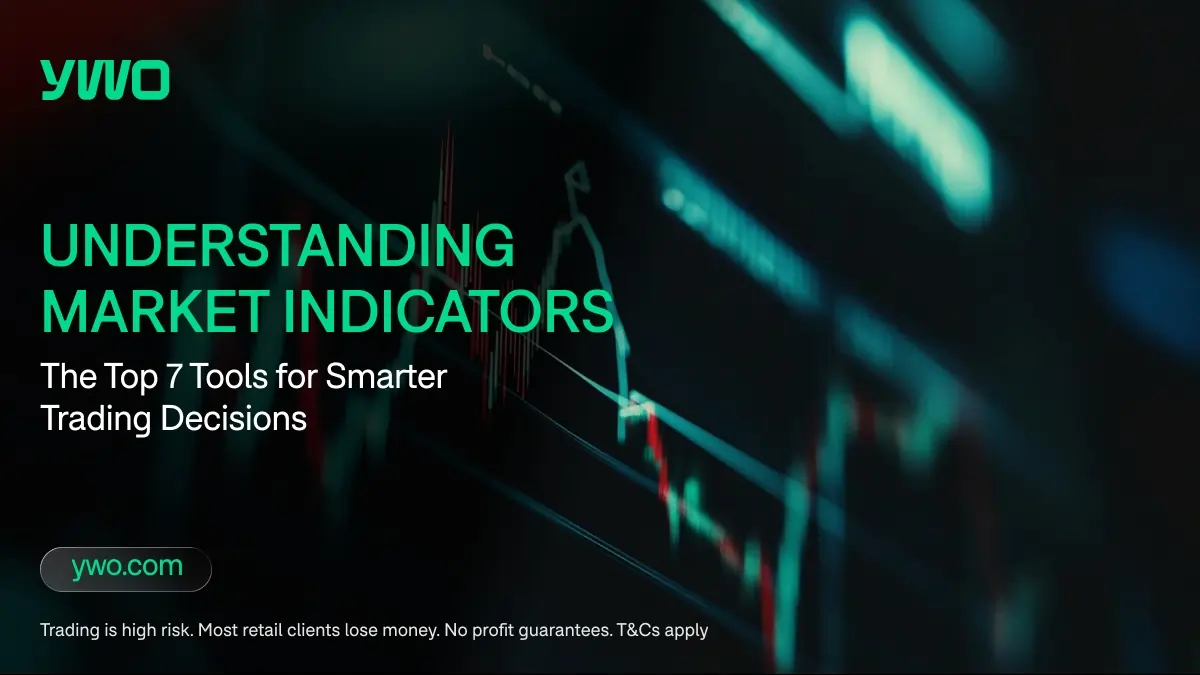
    Here are the top 7 indicators that are commonly used by traders and  they deserve a spot on your screen, stripped of the mystic mumbo-jumbo.

    1. Moving Averages (The Trend Filter)

    The Moving Average (MA) is the grandfather of technical analysis. It is blunt, simple, and essential. It calculates the average price over a specific number of periods, creating a smooth line that filters out the daily chop.

    • The 200-Day MA: This is the line in the sand for the long-term trend. Institutions watch it. If the price is above the 200-day, the market is generally viewed as being in an uptrend. If it is below, the market is often considered to be under pressure. It acts as a widely observed psychological support or resistance level.
    • The 50-Day MA: This is the intermediate trend. When the 50-day crosses above the 200-day (the “Golden Cross”), it is commonly interpreted as a bullish signal. When it crosses below (the “Death Cross”), traders often adopt a more cautious stance..

    Moving averages do not predict tops or bottoms. They tell you which way the wind is blowing so you don’t spit into it.

    2. Relative Strength Index (The Exhaustion Gauge)

    The RSI is a technical momentum oscillator. It measures the speed and change of price movements. It answers a simple question: has the market gone too far, too fast  based on recent price action?

    The RSI scale runs from 0 to 100.

    • Above 70: The market is commonly described as “overbought.” Buyers are exhausted, and a pullback may occur. 
    • Below 30: The market is commonly described as “oversold.” Sellers are exhausted, and a bounce may occur. 

    The trick with RSI is that in a strong trend, it can stay overbought or oversold for a long time. It is not a standalone sell signal. It is a warning light. It tells you that the rubber band is stretched, but it does not indicate timing or direction of future price movements.

    3. Volume (The Lie Detector)

    Volume is the only indicator that is not derived from price. It represents the number of shares or contracts traded. It is the fuel of the market.

    Price tells you what happened. Volume tells you how many people cared.

    • A breakout on low volume: This may be misleading. It suggests a lack of conviction. Market participants may not be fully supporting the move.
    • A breakout on high volume: This is generally viewed as more reliable. Larger market participants may be involved. The move has weight behind it.

    Volume confirms trends. If the price is rising but volume is falling, the trend may be running out of gas.

    4. MACD (The Trend-Momentum Hybrid)

    The Moving Average Convergence Divergence (MACD) is the Swiss Army knife of indicators. It combines trend-following with momentum. It tracks the relationship between two moving averages of a security’s price.

    Traders look for two things:

    • Crossovers: When the MACD line crosses above the signal line, it commonly interpreted as  a bullish entry signal. When it crosses below, it is considered as a bearish indication.
    • Divergence: This is the sophisticated play. If the price is making a new high but the MACD is making a lower high, it indicates that the momentum underneath the move is weakening. A reversal may follow.

    5. Bollinger Bands (The Volatility Trap)

    Bollinger Bands are volatility bands placed above and below a moving average. They expand when the market is wild and contract when the market is quiet.

    They are useful for identifying two states:

    • The Squeeze: When the bands get very narrow, it means volatility has died. This is often described as the calm before the storm. A significant move is often preparing to launch.
    • The Mean Reversion: Prices tend to stay within the bands. If the price touches the upper band, it is usually considered expensive. If it touches the lower band, it is considered cheap. Traders use this to observe extremes.

    6. VWAP (The Institutional Benchmark)

    The Volume Weighted Average Price (VWAP) is the only indicator on this list that resets every day. It calculates the average price a stock has traded at throughout the day, based on both volume and price.

    This is commonly used as the benchmark for institutional traders. If a mutual fund wants to buy a million shares, their bonus depends on buying them at a price better than the VWAP.

    • Above VWAP: The bulls are often viewed as in control.
    • Below VWAP: The bears are often viewed as in control.

    Day traders use VWAP as a dynamic support and resistance line. It can help illustrate who is currently winning the battle for the day.

    7. ATR (The Risk Manager)

    The Average True Range (ATR) does not tell you direction. It tells you volatility. It measures the average range of price movement over a set period.

    Why do you need it? For risk management purposes, including your stop-loss.

    If you place a tight stop on a volatile stock, you may get shaken out by random noise. If you place a wide stop on a quiet stock, you may be taking unnecessary risk.

    Professional traders often use ATR to inform their stop placement. A stop-loss might be placed “2 ATRs” below the entry price. This help ensures that the stop is based on the observed behavior of the market, not an arbitrary dollar amount.

    The Bottom Line

    Indicators are tools, not crutches. They help you frame the market, but they cannot trade for you. A hammer is a great tool for building a house, but if you don’t have a blueprint, you’re just smashing wood. Use these indicators to support your thesis, assist with risk management, and help filter out the noise. But never forget that the only thing that ultimately reflects market outcomes is price.

    Final Reminder: Risk Never Sleeps

    Heads up: Trading is risky. This is only educational information, not an investment advice.

  • Building a Solid Trading Plan: Essential Steps to Mastering Trades

    Building a Solid Trading Plan: Essential Steps to Mastering Trades

    Most people treat trading like a hobby, which is often leads to poor outcomes A hobby is something you do for fun when you have free time. A business is something you do with a plan, a structure, and clear risk expectations. If you approach the market without a plan, you are not a trader. You are providing an opportunity  for someone who is.

    A trading plan is not a vague notion of “buying low and selling high.” It is a personal document you sign with yourself. It is a set of hard rules that dictates exactly what you will do when the market inevitably punches you in the face. Without it, you are navigating a storm with a map drawn on a napkin.

    Here is how to build a plan that actually works, stripped of the motivational fluff.

    1. Define Your Identity (The “Who Am I?” Phase)

    Before you look at a chart, you need to look in the mirror. Who are you as a trader? This is not a philosophical question. It is a logistical one.

    Are you a scalper who thrives on adrenaline and can stare at a screen for four hours without blinking? Are you a swing trader who has a day job and can only check the charts in the evening? Are you a trend follower who is comfortable accepting a series of small losses in exchange for occasional larger outcomes at the end of the year for example??

    Your plan must match your lifestyle and your psychology. If you try to scalp while working a 9-to-5 job, execution becomes unrealistic. . If you try to trend-follow but have no patience, you may exit every winning trade too early. Define your timeframe, your preferred asset class, and your emotional tolerance for pain. If you don’t know who you are, the market is an expensive place to find out.

    2. The Setup: Your Weapon of Choice

    This is the technical core of the plan. What exactly are you looking for? A trading plan does not say “I look for good opportunities.” It says, “I buy when the price is above the 200-day moving average, pulls back to the 20-day moving average, and prints a bullish engulfing candle.”

    You need to define your setup with the precision of a computer code.

    • The Trend: How do you define the market direction? (e.g., Higher highs/higher lows, moving averages).
    • The Trigger: What specific event tells you to enter? (e.g., A breakout, a specific candlestick pattern, an indicator crossover).
    • The Filter: What conditions must be present to make the trade valid? (e.g., Volume must be 20% above average, RSI must be below 70).

    If you cannot write your setup on a post-it note, it is too complicated. Complex systems can fail under stress. Simple systems tend to survive.

    3. Risk Management: The Survival Manual

    This is the section that nobody wants to write, but it is the only section that matters. How much are you prepared to risk if a trade does not work as expected?

    Your plan must have hard numbers.

    • Risk Per Trade: Many experienced traders choose  to risk no more than 1-2% of your account on a single trade. This is the industry standard for a reason. It prevents a bad week from becoming a career-ending event.
    • Max Daily Loss: At what point do you turn off the computer? If losses reach a predefined daily limit, let’s say  5%,  of your account in a day, the  decision-making ability can be compromised. You are no longer trading; you are revenge-trading. Walk away.
    • Stop-Loss Placement: Where does your stop go? It should be based on the chart, not your wallet. A stop-loss is placed at the point where your trade thesis is invalid.. If that point represents too much risk, you may need to consider reducing your position size. You do not move the stop.

    4. The Exit Strategy: Getting Paid

    Entering a trade is easy. Exiting is where the money is made or lost. Most traders spend most  of their time thinking about entries and less thinking about exits. This is backwards.

    Your plan must dictate exactly how you will manage exits.

    • Technical Targets: Are you selling at the next resistance level? At a Fibonacci extension?
    • Trailing Stops: Are you going to trail your stop-loss behind the price to catch a trend? If so, what mechanism will you use? (e.g., A moving average, previous swing lows).
    • Time Exits: If the trade does nothing for three days, do you close it? Capital in inactive trades limits flexibility. 

    Live trades trigger emotion. Plans are written in logic. The edge comes from listening to the plan, not the feeling. .

    5. The Review Process: The Feedback Loop

    A trading plan is a living document. It needs to be reviewed regularly.  This can be  a boring part of trading, but it is one of the most important. 

    At the end of every week or month, you should review your trades. Did you follow the plan? If you lost money but followed the plan perfectly, that is a “good loss.” It is part of operating in the markets. . If you made money but broke your rules, that is a “problematic win.” This can reinforce bad habits. 

    You need to track your metrics. What is your win rate? What is your average winner versus your average loser? Which setups are working and which are burning cash? Without data, you are just guessing.

    The Contract

    Building a trading plan is an act of discipline. It is admitting that you are flawed, emotional, and prone to making impulsive decisions under pressure. It is creating a structure to protect you from yourself.

    The market is a chaos machine. It does not care about your feelings, your rent money, or your ego. It tends to reward disciplined behaviour and penalise careless behaviour. Your trading plan is your only shield. Write it down. Sign it. Stick to it. Or find a less costly  hobby.

    Final Reminder: Risk Never Sleeps

    Heads up: Trading is risky. This is only educational information, not an investment advice.

  • Cryptocurrency Trading Strategies: Navigating Volatility in Digital Assets

    Cryptocurrency Trading Strategies: Navigating Volatility in Digital Assets

    To trade it, you cannot use the gentle, well-mannered strategies of the stock market. You need a set of rules built for “chaos”.

    Trading crypto is not about finding “value” in the traditional sense. It is about identifying momentum, managing sharp price swings, and understanding that the market can react rapidly to information and sentiment shifts. Here are a few strategies commonly used  for this uniquely intense environment.

    1. The Breakout and Retest: Finding Structure in the Noise

    In a market with no fundamentals, no earnings reports, and no P/E ratios, the chart is all you have. Technical analysis in crypto is not about predicting the future; it is about finding the few areas where the herd has collectively decided to pay attention.

    The breakout and retest is the simplest form of this. A cryptocurrency will trade in a sideways range for days or weeks. This is a period of indecision, a coiled spring of compressed volatility. Eventually, the price will break out of this range, either up or down, often accompanied by a surge of volume.

    The amateur chases this breakout candle, buying at the top of the move and hoping it continues. This is a higher-risk approach.

    The professional waits for the retest. After the initial breakout, the price will often pull back to the level it just broke. This is the moment of truth. If the old resistance level now acts as new support, the breakout is confirmed. This can offer a more structured entry with a defined risk level just below the new support.

    In crypto, these patterns happen fast and fail often. But when they work, the resulting moves can be significant. A breakout in a traditional equity might result in a modest percentage move. In crypto, price swings can be materially larger over short timeframes.

    2. The “Narrative” Trade: Riding the Hype Cycle

    The crypto market is driven by stories. These stories, or “narratives,” can be about a new technology (like DeFi or NFTs), a platform upgrade, or simply a meme that catches fire. For a period of time, the market will fixate on this single story, and all the tokens associated with it will move together.

    The narrative trader is not a technologist. They are a cultural anthropologist. Their job is to identify the story that is gaining traction before the mainstream media picks it up. They monitor crypto-specific social media, track developer activity on platforms like GitHub, and listen to the chatter in niche communities.

    When a narrative starts to trend, they buy a basket of the top tokens in that category. They are not trying to pick the single winner. They are buying the entire theme. They ride the hype as long as the story is growing, and they sell the moment the narrative starts to feel tired or a new, shinier story appears.

    This approach carries a significant risk. Narratives can die as quickly as they are born. The trade requires a constant finger on the pulse of the market with no emotional attachment to  any single project.

    3. The Funding Rate Arbitrage: The Adult in the Room

    This is one of the few strategies in crypto that feels like it belongs in a finance textbook. It is a market-neutral approach that profits from the mechanics of the crypto derivatives market.

    In crypto perpetual futures, traders pay or receive a “funding rate” every few hours. This is a mechanism to keep the futures price tethered to the spot price. When the market is overwhelmingly bullish and everyone is going long, the funding rate becomes highly positive. Longs pay shorts. When the market is bearish, the funding rate becomes negative. Shorts pay longs.

    The funding rate arbitrageur exploits this. When funding is highly positive, they will short the perpetual future while simultaneously buying the equivalent amount of the coin on the spot market. Their position is delta-neutral; they do not care if the price goes up or down. They are simply collecting the high funding rate from the over-leveraged longs.

    This is not a get-rich-quick scheme. It is a grind. It is the crypto equivalent of being a landlord, collecting rent from overly enthusiastic tenants. It requires careful management of positions across multiple exchanges and an understanding of the plumbing of the derivatives market. But in a world of moonshots and rug pulls, it is one of the few strategies that feels like a real job.

    4. The Volatility Contraction Play: Preparing for Expansion

    The one constant in crypto is volatility. But it is not always high. It moves in cycles. Periods of intense movement are often followed by quieter phases. The volatility contraction play focuses on identifying when price ranges narrow and volatility declines.

    Using indicators like Bollinger Bands, a trader can identify when a cryptocurrency’s trading range has become unusually narrow. The bands squeeze together, indicating that volatility has dried up. This is the coiled spring.

    The trader does not try to predict the direction of the breakout. They simply place orders on both sides of the range. They might set a buy-stop order above the range and a sell-stop order below it. When the price finally breaks out, one of their orders is triggered, and they ride the subsequent expansion of volatility.

    This strategy requires quick reflexes and a tolerance for false breakouts. Often, the price will poke its head out of the range, trigger an entry, and then snap back inside. But when it works, it captures the explosive moves that define the crypto market.

    Navigating the Chaos: The Unspoken Rules

    Trading crypto is different. The market never closes, which can increase the risk of  burnout. The assets often lack traditional valuation anchors,, which makes traditional analysis difficult. The volatility can be severe enough to liquidate a leveraged position in minutes.

    Risk management is not just important in crypto; it is the only thing that matters.

    • Position sizes often need to  be smaller. A 10% move in a stock is a big deal. A 10% move in a cryptocurrency is “Tuesday”.
    • Stop-losses are widely used. . But they must also be wider to account for the volatility. A tight stop-loss in crypto is just a “donation” to the market makers.
    • The news cycle is a weapon. A tweet, a regulatory rumor, an exchange issue can reshape price action in seconds, often overpowering technical setups. Ignoring the news flow is like trading blind.

    In the end, crypto trading demands a strong focus on risk control. It attracts speculators, dreamers, and gamblers. The ones who last are the ones who treat it like the professional game it is: a  24/7 arena where risk is the only constant.

    Final Reminder: Risk Never Sleeps

    Heads up: Trading is risky. This is only educational information, not an investment advice

  • The Ultimate Guide to Risk Management in Trading: Protect Your Capital Like a Pro

    The Ultimate Guide to Risk Management in Trading: Protect Your Capital Like a Pro

    The market is full of traders who have great stories about the one time they significantly increased their account in a week. It is also full of traders who used to have an account. The difference between the two groups is rarely intelligence, or chart reading skills, or access to better information. The difference is risk management.

    Risk management is not the exciting part of trading. It is not about finding the perfect entry or predicting the next big move. It is about longevity. It is the boring, repetitive work of ensuring that when you are wrong, and you will be wrong often, you “live to trade” another day.

    Without it, trading becomes speculation driven more by emotion than structure.

    The First Rule: Capital Preservation

    The primary goal of a professional trader is not to make money. It is to limit losses. This sounds like a riddle, but it is the foundation of long-lasting careers in the markets. If you lose 50% of your capital, you need a 100% gain just to get back to breakeven. If you lose 90%, you need a 900% gain. The math of recovery is unforgiving.

    Professional risk management starts with a simple question: “If this trade goes completely wrong, how much will it hurt?”

    The answer should never be “a lot.” Most professional traders risk a small, fixed percentage of their account on any single trade—often 1% or 2%. This approach means they can be wrong multiple times in a row and still retain a meaningful part of their capital.. By contrast, a trader who risks 10% per trade and hits a bad streak is finished before lunch.

    Position Sizing: The Mathematical Edge

    Most less experienced traders determine position size by how much money they have available or how confident they feel. “I really like this setup, so I’ll buy 1,000 shares.” This is a subjective decision, not a strategy.

    The professional approach is mathematical. Position size is a function of risk distance.

    If your entry is at $100 and your stop-loss is at $95, you are risking $5 per share. If your account size dictates a maximum risk of $200 per trade, you can buy exactly 40 shares ($200 divided by $5). It doesn’t matter how much you “like” the trade. The math dictates the size.

    This approach normalizes risk. A volatile trade with a wide stop-loss will result in a smaller position size. A tight trade with a close stop-loss allows for a larger position. In both cases, the dollar amount at risk is consistent. This prevents one volatile loser from having a disproportionate impact on overall performance.

    The Stop-Loss: The Ego Killer

    A stop-loss order is an admission of defeat placed in advance. It is a line in the sand that says, “If the price reaches this point, my thesis is wrong, and I am out.”

    For many traders, this is psychologically painful. It feels like locking in a failure. They move the stop-loss further away, hoping the price will turn around. They turn a trade into an investment, and an investment into a “long-term hold,” which often leads to extended drawdowns..

    Professional risk management treats the stop-loss as a tool, not a judgment. It is placed at a technical level where the trade idea is invalidated: below a support zone, above a resistance level, or just outside a volatility band. Once placed, it is rarely moved further away. It acts as a safeguard against emotional decision-making..

    Risk-to-Reward Ratio: Choosing Your Battles

    Winning more trades than you lose is not necessary to be profitable. You can be wrong for example 60% of the time and still potentially have positive results if your winners are significantly larger than your losers.

    This is the concept of the risk-to-reward ratio. Before entering a trade, a professional assesses the potential upside against the predefined downside. If the risk is $100 and the potential reward is $100 (a 1:1 ratio), the trade is a coin flip. You need to be right more than 50% of the time over a series of trades to offset costs such as commissions.

    If the risk is $100 and the potential reward is $300 (a 1:3 ratio), you can lose two out of three trades and still approach breakeven in theory.. Professionals often look for asymmetric opportunities where the upside is greater than the downside. They filter out trades where the math doesn’t stack up, regardless of how good the chart looks.​

    Correlation and Portfolio Risk

    Risk doesn’t just exist in individual trades. It exists across the entire portfolio. A trader might think they are diversified because they have five different positions. But if those positions are Long Apple, Long Microsoft, Long Nvidia, Long Tech ETF, and Short Gold, they are highly exposed to similar market drivers, particularly  the tech sector and the US dollar.

    If tech crashes, several of those positions may move against the trader at the same time.. The 1% risk per trade can aggregate into a much larger portfolio drawdown over a short period..

    Professional risk managers look at correlation. They understand that during periods of market stress, assets often sell off together. . They manage exposure not just by ticker, but by sector, asset class, and currency, aiming to reduce the impact of any single macro event on the overall portfolio.

    The Psychology of Risk

    The hardest part of risk management is not the math but the discipline to respect the math when your pulse is racing. It is closing a losing trade when you are convinced it is about to turn around. It is taking a smaller position size when you feel “certain” about a winner.

    Risk management is the acceptance of uncertainty. It is the understanding that you have no control over the market, only over your exposure to it. The professional protects their capital as a limited resource, because preserving it is essential to staying active in the market..

    In the end, risk management is the only thing you can truly control. The market will do what it wants. Your job is to ensure that whatever it does, you are still around to trade tomorrow.

    Final Reminder: Risk Never Sleeps

    Heads up: Trading is risky. This is only educational information, not an investment advice

  • 5 High-Probability Swing Trading Strategies for Volatile Markets

    5 High-Probability Swing Trading Strategies for Volatile Markets

    Volatility is a strange beast. To the long-term investor, it is a source of anxiety, a rude interruption to the peaceful upward march of a retirement account. To the day trader, it is a necessary but chaotic ingredient. But to the swing trader, volatility is not an interruption. That’s the whole point.

    A swing trader is not looking for the safety of a long-term trend, nor the frenetic action of a scalper. A swing trader is a creature of the in-between. They are looking for the multi-day or multi-week “swings” that happen when a market gets temporarily dislodged from its senses. They are the people who wait for the market to panic, then calmly step in to exploit the overreaction.

    In a quiet, predictable market, a swing trader is bored. In a volatile, neurotic market, a swing trader is in their natural habitat. Here are five classic approaches they use to navigate the chaos.

    1. The Oversold Bounce (a.k.a. “The Rubber Band”)

    This is the bread-and-butter of the contrarian swing trader. The setup is simple: a good stock gets punished for a short-term or external reason. . The market reacts sharply over a headline, a sector-wide sell-off, or a broader risk sentiment.. The stock drops hard for three to five consecutive days, stretching far below its normal trading range.

    This is the “rubber band” effect. You stretch it, and stretch it, and stretch it, and eventually, it may snap back. The swing trader is not trying to predict the bottom to the exact penny. They are simply betting on the laws of physics. They see a stock that has been stretched too far, too fast, and they start looking for signs of exhaustion in the selling.

    The tools for this trade are straightforward. The swing trader uses indicators like the Relative Strength Index (RSI) to measure how “oversold” the stock is. An RSI reading below 30 is commonly referenced as the classic signal.

    They also look for a “capitulation” candle: a day with elevated volume where selling pressure begins to fade The swing trader steps in, responds to elevated  fear, and aims to ride the bounce back to a more rational price level. This is not a “buy and hold” position. It is a “buy the panic and sell the relief” operation.

    2. The Breakout Pullback (a.k.a. “The Second Chance”)

    Momentum traders love a breakout. They see a stock push through a major resistance level and they enter aggressively, chasing the price higher. This often works, but it is a high-stress way to live. The swing trader has a more patient approach. They wait for the second chance.

    Here is the setup: a stock breaks out of a long-term base on massive volume. The momentum chasers are ecstatic. The stock runs for a few days, and then it pauses. The initial excitement fades, early buyers take profits, and the stock “pulls back” to the level it just broke out from.

    This is the swing trader’s entry. The previous resistance level now needs to hold as a new support level. It is a test. If the stock bounces off that level, it suggests that the breakout was real.

    The swing trader enters here, getting a much better price than the chasers and with a clear, defined risk level just below the new support. It is a trade that combines the power of momentum with the patience of a value investor. It is also deeply satisfying, as it often involves buying from the same momentum traders who are exiting positions after a pullback.

    3. The Trend Reversal (a.k.a. “Calling the Turn”)

    This is the most difficult and potentially the most rewarding swing trade. It involves identifying a possible transition point where  a well-established trend dies and a new one begins. This is not for the faint of heart. It is like trying to step in front of a moving train, but doing it at the precise moment the train runs out of fuel.

    The setup for a potential bearish trend reversal looks like this: a stock has been in a clear downtrend for months, making a series of lower highs and lower lows. The swing trader is not trying to guess the bottom. They are waiting for the character of the trend to change.

    First, they look for a possible “higher low.” For the first time in months, the stock pulls back but does not make a new low. This is the first clue that the sellers  may be losing power.

    Second, they look for a “higher high.” The stock then rallies and breaks above its previous swing high. This is a key confirmation signal.  The pattern of lower highs and lower lows appears to be broken.

    The swing trader enters here, betting that a new uptrend could be forming. They are not chasing a bounce; they are buying the start of a potential new  structural shift. This trade requires immense patience, as a stock can be in a downtrend for a very long time. It also requires a strong stomach, as the first attempt to call the turn do not always succeed.

    4. The Volatility Squeeze (a.k.a. “The Coiled Spring”)

    Markets move in cycles of volatility. They go from periods of wild, chaotic swings to periods of quiet, narrow consolidation. The “volatility squeeze” is a trade that focuses on identifying  the end of the quiet period.

    The swing trader uses tools like Bollinger Bands to identify when a stock is getting quiet. Bollinger Bands are bands that are drawn two standard deviations above and below a moving average. When volatility is high, the bands are wide apart. When volatility is low, the bands “squeeze” together, becoming very narrow.

    This squeeze is a sign of stored energy. It is like coiling a spring. The longer the price stays in a tight, quiet range, the more pronounced t the eventual move can be. The swing trader does not care which way the spring uncoils. They simply wait for the price to break out of the squeezed range with conviction.

    If the price closes decisively above the upper Bollinger Band, they go long. If it closes decisively below the lower band, they go short. The trade is a response to expanding volatility, not a prediction. It is a way to engage with  the market’s inevitable shift from boredom to panic.

    5. The News Catalyst Fade (a.k.a. “The Reality Check”)

    This trade is based on a simple premise: the market can sometimes overreacts to news. A company reports slightly disappointing earnings, and the stock drops 20%. A biotech firm announces a minor setback in a clinical trial, and the stock falls sharply.

    The swing trader sees this not as a disaster, but as an opportunity. They let the initial panic play out. They wait for the emotional, headline-driven selling to exhaust itself. Then, they start to do the actual work. They read the report. They analyze the data. They ask a simple question: was the punishment proportional to the crime?

    Often, it is not. A 20% drop for a 2% earnings miss may reflect an emotional overreaction. The swing trader waits for the stock to form a short-term base, a sign that the panic-sellers are gone, and then they may enter. They are fading the emotional extremity of the market and positioning for  a reversion to a more sober reality.

    This trade requires a good understanding of fundamental analysis and a healthy dose of skepticism. The swing trader is not buying every dip. They are buying the dips that make no sense. It is a trade that pits cold, hard analysis against the market’s well-documented tendency to behave like a drama queen.

    Swing trading is a craft of patience and opportunism. It is not about being in the market every day. It is about waiting for the market to serve up a favorable setup, a on a silver platter, and then having the courage to take it. In a world obsessed with speed, the swing trader’s greatest advantage is their willingness to simply wait.

    Final Reminder: Risk Never Sleeps

    Heads up: Trading is risky. This is only educational information, not an investment advice.

  • Options Trading Strategies: A Comprehensive Guide to Calls, Puts, and Spreads

    Options Trading Strategies: A Comprehensive Guide to Calls, Puts, and Spreads

    The phrase “options trading” tends to split people into two groups. One group thinks of lottery tickets. The other thinks of complex payoff diagrams drawn by someone who enjoys spreadsheets too much. Both views miss the point. Options are tools. Sharp tools. In the right hands they can help structure and control to risk. In the wrong hands they turn a trading account into a bonfire.

    The aim here is simple. Strip out the mystery. Keep the sophistication. Walk through calls, puts, and spreads in a way that lets a reader see how experienced traders structure risk and probability, without sliding into hype about easy income. Education, not recruitment.

    What Options Really Are

    An option is a contract linked to an underlying asset, such as a stock or an index. A call option gives the buyer the right, not the obligation, to buy the underlying at a set price, called the strike, on or before a specific date.

    A put option gives the buyer the right, not the obligation, to sell in the same way. In both cases, the buyer pays a premium up front. That premium is the price of the right.​

    Education sources usually group option uses into three buckets. Speculation on direction, hedging of existing positions, and strategies involving option writing against owned assets. Calls and puts are the raw material for all of those. Spreads, which mix multiple options in one structure, sit on top as more refined versions of the same ideas.​

    Volatile markets make options more expensive, because the range of possible outcomes widens. That higher premium reflects higher implied volatility.

    For some traders that high cost is a deterrent. For option specialists that same volatility is the reason to pay attention, since larger price swings create conditions where structured trades may behave as intended.

    Calls: Structured Optimism

    A long call is the purest bullish option position. A trader buys a call when there is an expectation that the underlying could move up strongly before expiry. The attraction is simple. Risk is limited to the premium paid, while upside is theoretically open. That asymmetry appeals to traders who prefer defined loss and expanded upside potential on the positive side.​

    On the other side of that trade sits the call seller. This person receives the premium up front and takes on the obligation to sell the underlying at the strike if the buyer decides to exercise.

    If the underlying price stays below the strike, the seller keeps the full premium and no shares change hands. If the price rises above the strike, the seller faces losses that grow as price climbs. For that reason, professional education often stresses that uncovered call selling is among the riskiest positions in the option world.​

    In practice, traders build simple strategies around calls. A directional trader might buy out‑of‑the‑money calls before an earnings release,not as a guaranteed outcome,  but to limit risk to a small, known amount while still participating if the move is large. A longer‑term investor might sell covered calls against stock already held, exchanging some upside beyond the strike for immediate premium today.

    That covered call is often presented in guides as an introductory optionsstrategy, with the reminder that upside beyond the strike no longer belongs to the stockholder.​

    Puts: Structured Caution

    Puts reverse the direction. A long put benefits from decline in the underlying. Buyers of puts often appear pessimistic, but the most common users are cautious, not gloomy. A portfolio manager who holds a large stock position might buy index puts as protective exposure before a known risk event.

    The put behaves like a safety net. If markets drop sharply, losses in the portfolio may be partially offset by gains in the put position.​

    The put seller takes the opposite side. Selling a put brings in a premium up front and creates an obligation to buy the underlying at the strike if assigned. If price stays above the strike, the put expires without action and the seller keeps the premium.

    If the price falls below the strike, the seller might end up buying stock at the strike, which could be higher than the current market price. Education material often frames a cash‑secured put as “getting paid to wait for a better entry,” because the seller holds enough cash aside to buy at the strike if needed. It remains risk exposure to downside, even if structured.​

    Directional traders use long puts when they want downside exposure with limited risk. Shorting stock exposes the trader to borrowing costs and potentially significant losses  if price rises sharply. A long put defines the maximum loss as the premium. The trade‑off is time.

    Options expire. If the expected move takes too long to arrive, the put loses value as time passes, even if price drifts slowly in the right direction. That decay is part of the price of the cost of participating in the options market.

    Spreads: Tidy Risk In Messy Markets

    Spreads exist because reality rarely matches clean textbook moves. Markets gap, stall, overshoot, reverse. Buying a single call or put leaves the trader fully exposed to all of that noise. Spreads use a second option to reshape the payoff, limit risk, and often lower the upfront cost.

    A vertical spread, for example, combines one long option and one short option of the same type and expiry, but different strikes.​

    Take a simple bullish call spread. A trader buys a call at a lower strike and sells another call at a higher strike. The sold call brings in a premium that partially funds the bought call. The result is a position with limited downside and capped upside.

    The trader gives up profit beyond the higher strike in exchange for a cheaper entry. In volatile markets, vertical spreads often appear in textbooks and broker education as a way to express a directional view with more controlled exposure than buying a single call in a high-volatility environment.

    The bearish mirror is the put spread. A trader buys a higher‑strike put and sells a lower‑strike put. If price falls, the spread gains value up to the lower strike, beyond which profit stops growing. Here again, risk and reward live inside pre‑defined brackets. In choppy conditions, where sharp moves happen but rarely follow through in straight lines, many swing and position traders prefer these capped structures rather than open‑ended positions.

    More complex spreads, such as iron condors or butterflies, stack multiple options to build payoff profiles that may benefit from price staying inside a range or from volatility dropping after an event.

    Education resources often present these to more advanced traders, since they involve several legs and greater sensitivity to factors beyond direction, such as implied volatility and time decay. The common theme remains the same. Spreads trade unlimited possibilities for defined boxes of risk and reward.​

    Bringing Structure To Volatile Markets

    Calls, puts, and spreads exist for one reason. Markets move in ways that are not kind to straight‑line thinking. Volatility makes that movement more dramatic.

    Where a share position rises and falls one‑for‑one with price, an option position reshapes that line. Losses can be limited at a certain point. Gains may plateau after a level. Time influences value even when price stands still.

    Short‑term traders use options to create leverage without borrowing on margin. Longer‑term investors use them to protect portfolios or generate steady inflows from premium received. Swing traders use spreads to express views on direction and volatility together, rather than direction alone.​

    The sophistication does not sit in the buzzwords. It sits in the willingness to think in probability, not certainty. A call expresses the view that strong upside is worth paying for while accepting a known loss if nothing happens.

    A spread expresses the view that a move will likely stay inside a band. A put under a portfolio expresses the view that paying an insurance bill can be  preferable to pretending nothing bad ever happens.

    Options do not make a trader smart. They simply highlight whether whether the thinking behind a trade had structure in the first place.

    Final Reminder: Risk Never Sleeps

    Heads up: Trading is risky. This is only educational information, not an investment advice

  • Day Trading Strategies: A Beginner’s Guide to Market Entries

    Day Trading Strategies: A Beginner’s Guide to Market Entries

    The first thing a scalper does in the morning isn’t check the news, analyze the overnight futures or read a market outlook report. The first thing a scalper does is test their internet connection.

    They run a speed test. They check their ping to the server. They treat their router with the kind of cautious reverence that a deep-sea diver gives to their oxygen tank.

    This small ritual tells you everything you need to know about scalping. It is not a game of grand ideas. It is a game of tiny details, where a tenth of a second of lag can be the difference between a clean trade and a donation to a  missed opportunity..

    What Scalping Is (and What It Is Not)

    Scalping is the art of capturing very small price movements, often doing it dozens, or even hundreds of times in a session. . While a day trader might look for a dollar move in a stock, a scalper is fighting for three cents.

    While a Forex swing trader is targeting a 150-pip trend, a scalper is trying to grab four pips and disappear before anyone notices they were there.

    The holding period for a scalp is brutally short. A long trade might last ninety seconds. A short one is over in the time it takes to sneeze. The goal is not to be right about the direction of the market for the day. The goal is  to have a view on the very short-term movement, sometimes within just a few seconds or minutes.

    This is not investing. This is not even trading in the traditional sense. It is a highly active fast-paced style performed by people who are comfortable working with rapid decisions and constant screen time. The logic is statistical. A scalper does not need to be a market wizard.

    They need to have a simple, repeatable setup that may provide an edge, combined with the discipline to execute consistently while their screen flashes like a broken traffic light.

    Forex vs. Stocks: Choosing Your Arena

    A scalper can operate in either the forex or the stock market, but the experience is different. It is like being a pickpocket in a crowded train station versus a quiet art gallery. Both require skill, but the environment changes the technique.

    The Forex Market: The 24-Hour Casino
    The forex market, particularly major pairs like EUR/USD or USD/JPY, is the natural habitat of the scalper. The liquidity is exceptionally deep, with large volumes moving at all times.. This ensures the spread—the gap between the bid and ask price—is usually razor-thin. A scalper in EUR/USD might pay less than a pip to get in and out of a trade.

    The forex market never sleeps, which is both a blessing and a curse. A scalper can trade the London open, the New York session, or the Tokyo drift. The downside is that there is always a reason to be at the screen.

    Effective forex scalpers learn to treat the market like a shift-worker, clocking in for the high-volume sessions and ignoring the rest.

    The Stock Market: The Order Book Game
    Scalping stocks is a more tactical affair. While Forex is a decentralized ocean of liquidity, the stock market is a collection of ponds, each with its own visible order book (Level 2). This is where the stock scalper finds their edge. They can see the “walls” of buy and sell orders stacking up.

    A stock scalper watches the order book like a poker player watches their opponent’s hands. They see a huge sell order at $50.05 and a huge buy order at $50.00. This suggests the price may move within that zone temporarily.

    A scalper could then attempt to trade within that range, responding to how the market behaves around those visible levels. It is a game of interpreting intentions as much as interpreting prices..

    The Scalper’s Toolkit: Simple, Fast, and Brutal

    A scalper’s chart is not a work of art. It is a functional, ugly tool designed for speed. You will not find twelve different indicators and five trend lines. You will find a few essential things:

    • A 1-Minute Chart: This is the high-resolution map of the immediate territory. Anything longer than 5 minutes is ancient history.
    • A Few Moving Averages: A fast one (like a 9-period) and a slow one (like a 20-period) to give a quick visual read on the immediate trend. Is the price above or below the average? That is all the information needed.
    • The Order Book (Level 2): For many stock scalpers, this is non-negotiable. It is like trying to drive without a windshield.
    • Time & Sales (The “Tape”): This shows every single transaction as it happens. A scalper watches the tape to see the aggression of buyers and sellers. Are the trades hitting the bid or lifting the offer? This tells the scalper who is in control right now.

    Anything else is a distraction. A scalper who spends time analyzing a MACD crossover on a 1-minute chart has already missed ten trades.

    The Unspoken Rules of Scalping

    Mastering scalping is less about finding a magic setup and more about internalizing a few painful truths.

    1. Your Broker Is Your Biggest Opponent.
    Every trade you take has a tax. The spread is a tax. The commission is a tax. Slippage is a tax. A scalper aiming for a tiny profit is in a constant war against these frictions. Your choice of costs and execution quality matters more than your entry signal.. A scalper with a high-cost broker is like a swimmer trying to race with a winter coat on. It is possible, but it is not smart.

    2. You Must Love Being Wrong.
    A scalper will take dozens, sometimes hundreds, of trades in a day. A significant portion of them will be losers. If your ego is tied to your win rate, you will not survive. A successful scalper treats a losing trade with the same emotional detachment as a fly swat. It is a minor, unavoidable nuisance. You acknowledge it, you move on, and you do not let it affect your next action.

    3. Boredom Is Your Enemy, Not Losses.
    The biggest risk for a scalper is not a bad trade. It is the ten minutes of silence between good trades. The market will go quiet. The setups will disappear. The urge to “make something happen” will become overwhelming. This is when the scalper takes a stupid trade, gets angry, and then spends the next hour trying to “win it back.” The most successful scalpers are the ones who have mastered the art of sitting on their hands.

    4. Technology Is Not a Crutch. It Is the Weapon.
    A scalper with slow internet is a soldier with a wet musket. You need a hard-wired connection. You need a platform that doesn’t freeze. You need hotkeys programmed for instant order execution. When technology slows you down, short-term strategies become significantly more difficult to manage.

    Scalping is not a path to easy money. It is a profession that demands the focus of an air traffic controller, the reflexes of a fighter pilot, and the emotional stability of a rock. It is a career spent in the trenches of the market, fighting for inches. Many who try it step away because of the pace; those who continue tend to value the structure and intensity of the process.They are a strange breed, but they are never, ever bored.

    Final Reminder: Risk Never Sleeps

    Heads up: Trading is risky. This is only educational information, not an investment advice.

  • Position Sizing Mastery: Using Volatility to Set Optimal Risk

    Position Sizing Mastery: Using Volatility to Set Optimal Risk

    A trader identifies a high-probability setup on the GBP/JPY chart. The pattern appears clear,  supported  by multiple indicators, and aligns with a tested strategy.

    The trader executes the trade with a standard two-lot position, the same size used for a previous trade on EUR/CHF. The market moves against the position, hits the stop loss, and produces a loss large enough to offset gains from several prior trades.

    The strategy  itself may have been sound, but the outcome was affected by risk management – specifically, position sizing. Treating all trades equally with a fixed lot size ignores the unique personality and volatility of each currency pair. This common oversight is a primary reason why many technically proficient traders struggle to achieve consistent results.

    Effective risk management requires a dynamic approach, one where position size is influenced by the market’s current volatility rather than habit.

    The Inadequacy of Fixed-Lot Sizing

    Many developing traders adopt a fixed-lot or fixed-unit approach to position sizing. They trade one standard lot, or five mini lots, on every single transaction, regardless of the asset or market conditions. This method offers simplicity but creates uneven risk exposure.

    The fundamental flaw is that a 50-pip stop loss on a low-volatility pair like EUR/CHF represents a vastly different level of risk compared to a 50-pip stop on a historically volatile pair like GBP/JPY.

    An analysis of market behavior shows different pairs have different average daily ranges. For example, some pairs might move 50 pips on an average day, while others move 150 pips. Using the same position size on both instruments means the financial risk on the more volatile pair is three times greater.

    This inconsistency can make performance measurement difficult and expose an account to larger drawdowns than intended. A sequence of losses on high-volatility pairs can create pressure that takes time to recover from and may lead to further decision-making errors.

    Integrating Volatility into the Sizing Model

    A more sophisticated approach ties position sizing directly to market volatility. This ensures that the capital at risk on any given trade remains constant, regardless of the instrument or its current price behavior. The goal is to risk a specific, predetermined percentage of the trading account on every setup. This method turns risk into a fixed variable in an otherwise uncertain environment.

    One of the most effective tools for measuring volatility is the Average True Range (ATR). The ATR is an indicator that measures the average range of price movement over a specified period, typically 14 days. It provides a current, objective reading of how much an asset is moving.

    A rising ATR indicates increasing volatility, while a falling ATR may suggest a decrease in volatility. By incorporating the ATR into the position sizing calculation, a trader can systematically adjust exposure based on real-time market conditions.

    A Formula for Volatility-Adjusted Sizing

    Calculating position size using volatility is a straightforward process. It involves defining risk first and then determining the position size based on that definition. This method ensures risk is a deliberate choice, not an unintended outcome of a trade.

    The steps are as follows:

    1. Define Trade Risk: The trader first decides on the maximum percentage of the account to risk on a single trade. A common metric among professional traders is typically 1% to 2% of total equity. For a $50,000 account, a 1% risk limit means no single trade should lose more than $500.
    1. Determine Stop Loss Placement: The stop loss should be placed at a logical technical level, such as behind a key support or resistance zone, not at an arbitrary pip distance. The distance from the entry price to this technical stop loss is the stop loss in pips. Volatility can inform this placement; for instance, a stop might be placed at a multiple of the current ATR value, such as 2x ATR, to avoid being stopped out by normal market noise.
    2. Calculate Position Size: With the risk amount and stop loss distance known, the final calculation is simple. The formula ensures that if the stop loss is hit, the resulting loss equals the predetermined risk amount.

    To illustrate, consider a trader with a $50,000 account and a 1% risk rule ($500 per trade). The trader wants to buy EUR/USD, and the 14-day ATR is 80 pips. A technically sound stop loss is placed 100 pips from the entry price. The value of one pip for a standard lot of EUR/USD is $10.

    • Risk Amount: $500
    • Stop Loss in Pips: 100
    • Position Size = $500 / (100 pips * $10 per pip) = 0.5 standard lots.

    If the same trader targets a less volatile pair where the stop loss is only 40 pips away, the calculation changes:

    • Risk Amount: $500
    • Stop Loss in Pips: 40
    • Position Size = $500 / (40 pips * $10 per pip) = 1.25 standard lots.

    The model automatically adjusts the position size upward for lower-volatility setups and downward for higher-volatility ones, keeping the dollar amount at risk consistent

    The Benefits of Dynamic Sizing

    Adopting a volatility-based position sizing model offers several distinct advantages for a trader’s performance and psychology. It introduces a layer of systematic risk control that static methods lack. This is particularly important in the modern forex market, which has seen periods of heightened volatility due to factors like tariff policies and economic uncertainty. Global forex turnover was reported at high levels in recent years partly fueled by such dynamics.​

    Key benefits of this approach include:

    Consistent Risk Exposure: Every trade carries the same predetermined financial risk, leading to a more stable equity curve.

    Adaptation to Market Conditions: The model inherently encourages a trader to reduce exposure during volatile periods and allows for larger positions during quiet markets. This is a defensive mechanism that may help protect capital when uncertainty is high.

    Improved Trader Psychology: By pre-calculating the maximum possible loss, a trader removes a significant source of emotion. The fear of large, unexpected losses can be minimized, allowing the trader to focus on executing the strategy correctly rather than worrying about the outcome of a single trade.

    Objective Decision-Making: The position sizing calculation is entirely mathematical. It removes guesswork and emotional impulses from the process of determining how much to trade.

    Mastery of position sizing is a key skill that  helps distinguish traders who operate effectively over the long term.. While a profitable trading strategy is essential for identifying opportunities, a robust position sizing model is what can support long-term survival and capital preservation. By using volatility to set optimal risk, traders shift their focus from predicting prices to managing exposure, a fundamental characteristic often seen by professional market operators.

    Risk Disclaimer

    Trading financial instruments carries a high level of risk and may result in losses. Past performance is not a reliable indicator of future results. The information provided is for educational purposes only and does not constitute investment advice. Ensure you fully understand the risks involved and seek independent advice if necessary.

  • Patience and Probability: Thinking Like a Casino, Not a Gambler

    Patience and Probability: Thinking Like a Casino, Not a Gambler

    Visit any casino and observe the two distinct psychologies at play. On one side of the table sits the gambler, riding a rollercoaster of hope and fear, his focus locked on the outcome of the next hand. A win brings elation, a loss brings despair. He is playing a game of luck.

    On the other side is the house. The casino does not care about any single roll of the dice or spin of the wheel. It does not get excited when a player wins or panic when a table gets hot.

    The casino is playing a different game entirely, a game of mathematics and probability. It knows that over thousands of events, its small, persistent statistical edge is expected to generate a long-term advantage..

    The amateur trader behaves like the gambler. The professional trader seeks to think more like the casino. This mental shift, from focusing on individual outcomes to managing long-term probabilities, is the most profound transition a trader can make.​​

    The flawed mindset of the gambler

    The trader who operates like a gambler is easy to spot. Their decision-making is driven by emotion and a desire for immediate gratification.​

    • They seek certainty: They hunt for a perfect indicator or a strategy that never loses, an impossible goal that leads to constant system-hopping.
    • They personalize outcomes: A winning trade is seen as proof of their skill, while a losing trade feels like personal failure or market unfairness..​
    • They lack patience: They cannot stand to be out of the market. They feel the need to be constantly active, often out of boredom or a fear of missing out.​
    • They chase losses: Like a gambler on a losing streak, they abandon risk management after a loss, increasing position size in an attempt to recover..​

    This approach is unsustainable. It treats trading as a series of disconnected bets, with each outcome carrying an immense emotional weight. This emotional volatility makes disciplined execution impossible.

    The disciplined mindset of the casino

    The casino operator embodies the principles of professional speculation. They have accepted uncertainty and built a business model around a statistical advantage, known as the “edge”.​

    1. They Know Their Edge: The casino understands the probability of every game it offers and operates with a measurable, statistical advantage.. . They do not need to know what will happen next, only over many events,, the edge is likely to produce positive results. For a trader, this “edge” is a trading strategy that, with a tested, data-backed expectation of profitability over a sufficiently large sample of trades.
    2. They Think in Large Numbers: A casino is not profitable because it wins every hand, but because it applies its edge consistently across thousands of outcomes.. The law of large numbers ensures that the short-term randomness will eventually smooth out to reflect the underlying probability. Similarly, a disciplined trader thinks in terms of long-term performance rather than individual trades, understanding that probability tends to even out over time..​
    3. They Manage Risk Impersonally: Casinos have table limits to control exposure.. A professional trader applies the same principle through strict position sizing, typically risking only 1% to 2% of their capital on any single trade. This ensures no single outcome can cause major damage to overall capital.
    4. They Exhibit Unwavering Patience: The casino opens its doors every day and runs its games according to the same set of rules. It does not change the rules because one player is on a winning streak. It has the patience to let its edge play out. Likewise a patient trader waits for market conditions to meet the exact criteria of their plan before acting. They understand that waiting is an active part of the strategy.​

    How a trader becomes the house

    Transitioning from a “gambler” to a “casino” requires a structured, probability based approach built on repeatability and risk control..

    Develop and Test a Strategy: A trader must define a specific strategy with clear, unambiguous rules for entry, exit, and risk management. This strategy must then be back-tested and forward-tested to prove it has a positive expectancy. This is the process of defining the edge.


    Execute with Flawless Discipline: Once the edge is defined, the trader’s only job is to execute it consistently. This means taking every valid setup the plan generates and refraining from any trade that falls outside the rules.


    Treat Losses as Business Expenses: The casino views payouts to winning gamblers not as losses, but as the cost of doing business. A professional trader must adopt the same view. A losing trade that followed the plan is simply a business expense, the cost of finding out if a setup will work. It carries no emotional weight.​


    Keep Meticulous Records: A trader must journal every trade to collect data on their performance. This data allows them to analyze their results over a large sample size and confirm that their edge remains intact. It shifts the focus from anecdotal feelings to statistical reality.

    A trader who adopts this mindset moves beyond emotional reaction and begins to think probabilistically They understand that their success is defined not by any single outcome, but by their consistency in managing risk and executing a tested plan. They stop gambling and start operating systematically.. They have become the house.

    A Final Word on Risk

    Even with a disciplined, probability-based approach, trading remains inherently uncertain. No system, strategy, or mindset can eliminate the risk of loss. The objective of a professional trader is not to avoid losses entirely, but to manage them intelligently — ensuring that no single trade or series of trades can jeopardize long-term participation.

    Patience, risk control, and data-driven decision-making form the core of sustainable trading. By focusing on process over outcome, traders give themselves the best chance to navigate market uncertainty responsibly.

    Trading involves substantial risk. This content is for informational and educational purposes only and does not constitute investment advice.

  • Pre-Trade Routines: A Practical Framework for Disciplined Execution

    Pre-Trade Routines: A Practical Framework for Disciplined Execution

    Elite military pilots follow a meticulous pre-flight checklist before every mission, regardless of their experience. They verify fuel levels, test control surfaces, and confirm communication systems. They do this not because they forget how to fly, but because they know that in a high-stakes environment, disciplined procedure is the only defense against human error. A small oversight on the ground can lead to a fatal mistake in the air.

    For a professional trader, the market is the airspace. The time before a trade is placed is the runway. A pre-trade routine is the non-negotiable checklist that ensures every trade is launched from a position of stability, clarity, and control, transforming the emotional act of speculation into a methodical business process.

    The purpose of a pre-trade routine

    Trading appears to be a profession of action, but successful trading is a profession of preparation. A pre-trade routine is a structured sequence of tasks performed before market engagement. Its purpose is to shift the trader from a reactive mindset to a proactive one.

    It creates a necessary buffer between an idea and its execution, allowing for objective analysis to override emotional impulse. Without a routine, a trader is susceptible to chasing price movements, acting on tips, or entering trades out of boredom. A routine ensures that every action is deliberate and aligned with a master plan. It systematizes discipline, making it a habit rather than a struggle.​

    A framework for daily preparation

    A complete routine consists of two main parts: a daily market overview done before the trading session begins, and a specific checklist applied to every single trade.

    Part 1: The Daily Market Briefing

    This is the strategic overview, the “weather check” for the trading day. It should be performed at the same time every day to build consistency.

    1. Review the Economic Calendar: Identify all major economic news releases scheduled for the day. This includes interest rate decisions, inflation reports, and employment data. A trader must know when periods of high volatility are expected to avoid being caught in unpredictable market reactions.​
    2. Assess Overnight Market Activity: Analyze how the markets behaved during the preceding Asian and European sessions. Where did major currency pairs close? Was there significant price movement on any related assets, like commodities or indices? This provides context for the upcoming session.​
    3. Define the Prevailing Sentiment: Determine the market’s general mood. Is it “risk-on,” with traders favoring higher-yielding currencies, or “risk-off,” with capital flowing to safe havens like the Japanese yen or Swiss franc? Understanding sentiment can help align trades with broader flows..​
    4. Identify Key Technical Levels: Before looking at any specific setups, a trader should mark the major daily and weekly support and resistance levels on the charts of their chosen instruments. These are the significant price areas that are likely to influence market direction throughout the day.​


    Part 2: The Pre-Trade Execution Checklist


    This is the tactical checklist, the final go/no-go sequence performed y before any order is placed. It confirms that the trade aligns with the trader’s plan and risk parameters.

    Checklist ItemQuestion
    Strategy ConfirmationDoes this setup align with a clearly defined entry condition in the trading plan? ​
    Multi-Timeframe AlignmentDoes the trend on the higher timeframes (e.g., daily, 4-hour) support the direction of this trade on the lower timeframe?
    Risk CalculationIs the position size calculated to risk no more than the pre-set percentage of account capital (e.g., 1%)? ​
    Exit Point DefinitionAre the exact price levels for the stop-loss and the take-profit orders identified and ready to be placed? ​
    Risk-to-Reward RatioDoes this trade offer a potential reward that is a sufficient multiple of its risk (e.g., at least 2:1)?
    Emotional State CheckIs this trade being entered from a state of calm objectivity, or is it influenced by fear, greed, or impatience?


    A trader must be able to answer “yes” to all these questions. If even one answer is “no,” the trade may need to be postponed or reassessed. This reinforces consistency and protects against emotional decision-making.

    Making the routine a physical habit

    A routine is most effective when it is a physical, tangible process. Traders are encouraged to print out their pre-trade checklist and have it on their desk. The act of physically ticking off each item before placing an order creates a powerful psychological barrier to impulsive behavior. It forces a pause and a moment of objective reflection.

    Over time, this habit can be the difference between disciplined execution and impulsive trading. Some traders even use a two-person rule in their early careers, requiring them to explain the rationale for a trade to a colleague or mentor, using the checklist as a script, before they are allowed to execute it.​

    The long-term benefits of a disciplined start

    Adhering to a pre-trade routine does more than reduce errors.. A trader who follows a structured process knows that their actions are repeatable and based on tested criteria. This helps manage the emotional impact of losses, framing them as part of a long-term system rather than personal failures.

    Moreover, a standardized routine preserves mental energy. By automating preparatory steps, the trader can focus more effectively on real-time analysis and trade management.

    A pilot does not resent the pre-flight checklist, but they see it as the foundation of a safe flight. A surgeon does not skip the pre-operative briefing: they see it as essential for a successful outcome. A professional trader must view their pre-trade routine in the same light. It is not a burden. It supports consistent, professional-level execution in an environment defined by uncertainty..

    A Final Word on Risk

    Even the most disciplined preparation cannot remove uncertainty from trading. A pre-trade routine strengthens structure and decision-making, but it does not guarantee outcomes. Markets can behave unpredictably, and losses are an inherent part of participation. The objective of such routines is not to eliminate risk, but to manage it through consistency and process. Over time, this disciplined approach can help preserve capital, maintain emotional balance, and support long-term trading sustainability.

    Trading involves substantial risk. This content is for informational and educational purposes only and does not constitute investment advice.